Natural Gas – Week In Review
Looking back at natural gas report week, February 24, 2022, March moved off the books on Thursday, settling the month at $4.568/Dth, the highest March settle since 2014 when a polar vortex lingered over North America, bringing historically cold temperatures through April.
While prices have, on average, been higher than pre-pandemic days, with less than six weeks left in withdrawal season, the persisting market volatility isn’t typical. It’s possible to write some of it off as late-season cold, but there’s been a recurring theme in price volatility analysis since last fall.
The answer, by this point, is probably easier to deduce than today’s Wordle answer.
Let’s take a look.
Natural Gas Market – A Quick Recap
A few brief words on the basics before we step into the quagmire of natural gas prices and geopolitical upheaval that escalated across the last few days.
Last week’s draw from storage was a modest 129 Bcf, compared to last year’s draw of 324 Bcf and the five-year average of 166 Bcf. Overall production was down slightly as was heating-related consumption.
Presently, the pace of withdrawal from storage is 6% higher than the five-year average rate of 8.1 Bcf/d. If withdrawals from storage match the five-year average rate, the EIA projects we’ll begin injection season with 1,452 Bcf in storage, just 214 Bcf below the five-year average.
Russia, Ukraine, and Energy Prices
Initially, Russia’s invasion into Ukraine stoked fears of global economic turmoil and upended investor confidence, leading to early drops for the Dow, S&P 500 and Nasdaq. Market rebound stalled through mid-day in anticipation of allied response.
Market Movement
Meanwhile, Ukrainian Foreign Minister, Dmytro Kuleba, called for Russian removal from the Swift international payment system, a move that would most certainly roil Russian and international markets alike. The significance of the potential impact left leaders split on the decision so it was left as a last resort. According to Bloomberg, should that option become reality, “…payments for Russian gas supplies would become impossible. That would be a cause for contractual force majeure leading to a halt in supplies, with dramatic consequences for European consumers from physical availability and price perspectives.”
Absent a consensus on the matter, the U.S. opted for additional sanctions but stopped short of advocating for removing Russia from Swift and notably left Russia’s energy industry unscathed. Domestic indices recovered following announcement of the decision but remain tentative as the Ukrainian crisis unfolds.
While most financial indicators were marked by an initial decline, energy markets surged with oil prices above $100/barrel for the first time since 2014. Given Russia is the world’s third largest oil producer, accounting for more than 10% of the world’s oil supply and 40% of gas to the EU, supply interruptions will certainly spell more volatility for European energy prices, likely triggering increases in domestic prices.
European prices
Europe started winter heating season with storage shortfalls that led to skyrocketing prices. Russian promises for additional natural gas supplies briefly subdued prices until it became clear those promises would go unmet. Since then, mild winter temperatures and additional shipments of U.S. LNG helped control previously record-breaking natural gas prices. As this played out, it became clear domestic natural gas prices were moving in tandem with European volatility.
Now, with Russia’s actions in focus, reports have emerged claiming that Europe receives as much as 40% of their natural gas supply from Russia. Yet in July, Russia had already started reducing natural gas flows to Europe.
“Natural gas flows at the westernmost point of the Yamal pipeline dropped to 20 million cubic meters per day in mid-August, according to ICIS. This was down from 49 mcm per day at the end of July, and a sharp fall from its typical rate of 81 mcm per day.
What’s more, European piped natural gas supply from Russia is expected to slip even further in September.”
(If you have the time, the entire article is worth reading.)
An Uncomfortable Peace?
Nonetheless, amid escalating tensions, following as much as a 60% spike in European natural gas prices, Europe and Russia looked away from the raging turmoil to negotiate natural gas deliveries. “Utilities are ordering more of the fuel under long-term contracts with Gazprom PJSC. That’s because the deals are priced in such a way that Russian imports are now cheaper than spot gas traded at European hubs. The development follows months of limited Russian exports.”
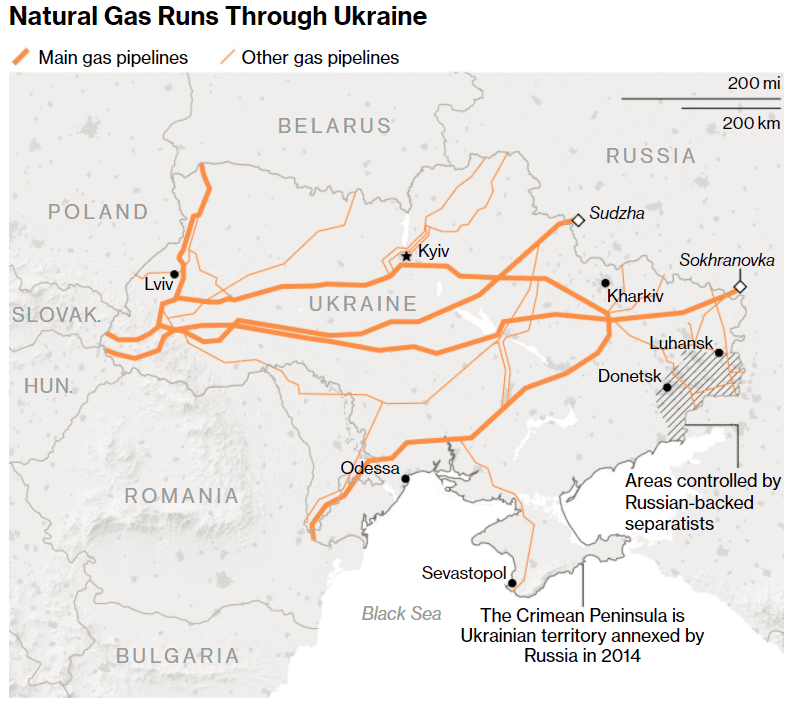
Here it’s worth noting roughly 1/3 of natural gas transport from Russia to Europe runs through Ukraine. Nonetheless, Gazprom maintains the pipelines are safe and operational despite the conflict. In the event that changes and European supply is threatened, it’s likely volatility will return.
For further reading, check out our related posts:
Nord Steam 2 Pipeline
Returning to the international spotlight after a reprieve from contention, progress on the Nord Stream 2 pipeline was once more halted when Germany blocked continuation of the certification process.
The pipeline runs alongside a second Nord Stream pipeline completed in 2011 and travels under the Baltic Sea from Russia to Germany. Prized by Russia as more efficient than the aging pipelines running through Ukraine and Poland, it’s completion would allow Russia to transport gas to Europe while avoiding transit tariffs.
At the same time, the US, UK, Poland, and Ukraine maintained the pipeline would lead to increased Russian control over European nations by politically leveraging access to natural gas supply.
Even though it may result in German reliance on Russian natural gas, it’s evident supply limits translate to higher European natural gas prices and that, in turn, impacts volatility at home.
Also read: Biden Administration Waives Sanctions Against NORD Stream 2 Developer
Natural Gas Market Report – February 24, 2022
April NYMEX
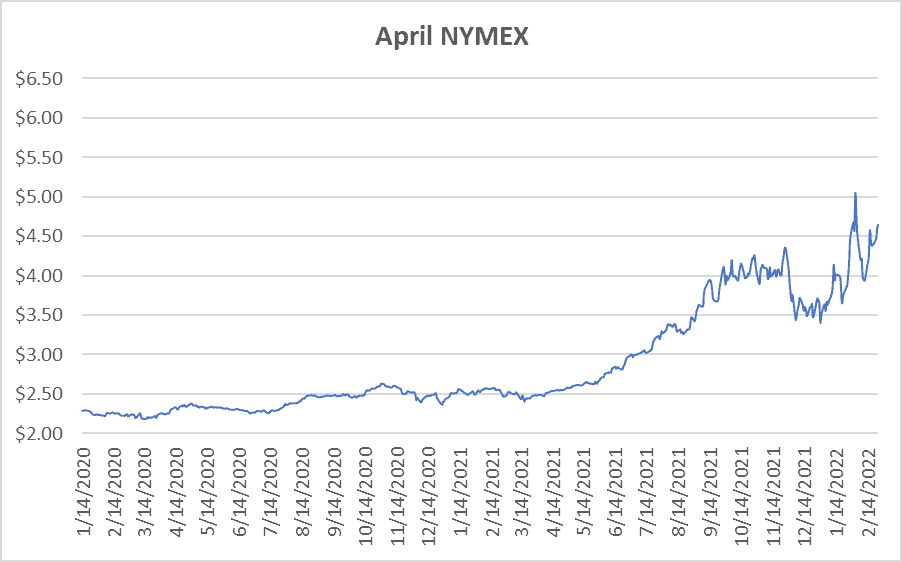
March moved off the board Thursday, February 24th, settling the month at $4.568/Dth.
April settled Thursday at $4.641/Dth, up 4.8 cents from Wednesday’s close at $4.593/Dth and up 21.1 cents over the prior week.
12 Month Strip
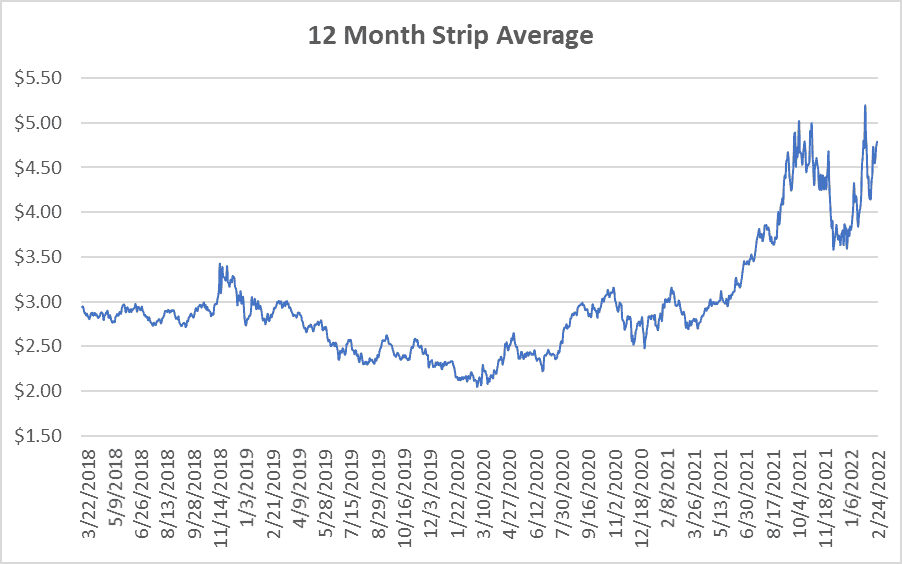
Settled Thursday at $4.786/Dth, up 18.7 cents from the prior week.
Seasonal Strips
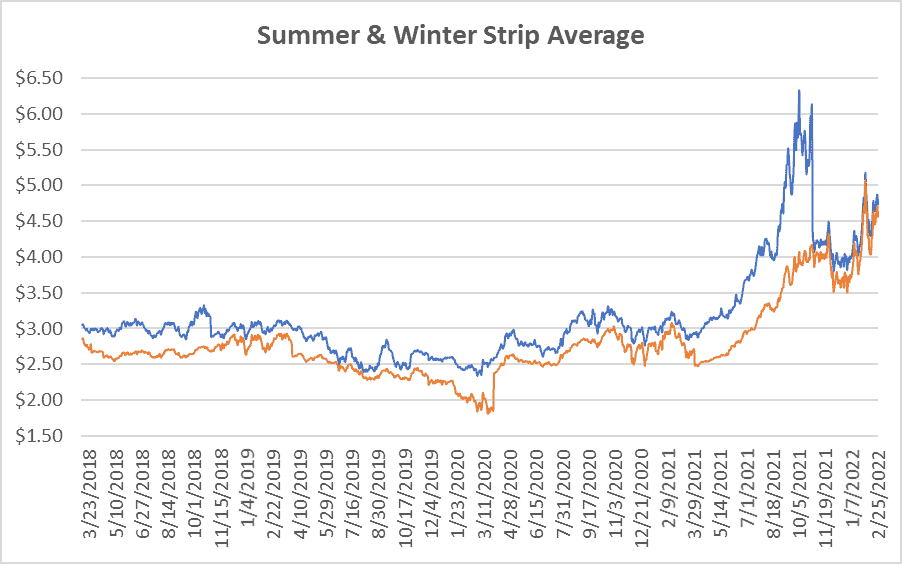
The summer strip (APR22-OCT22) settled at $4.714/Dth, up 19.9 cents from the week prior.
The winter forward (NOV22-MAR23) settled Thursday at $4.871/Dth, up 19.0 cents from the week prior.
Calendar Years 2022/2023/2024
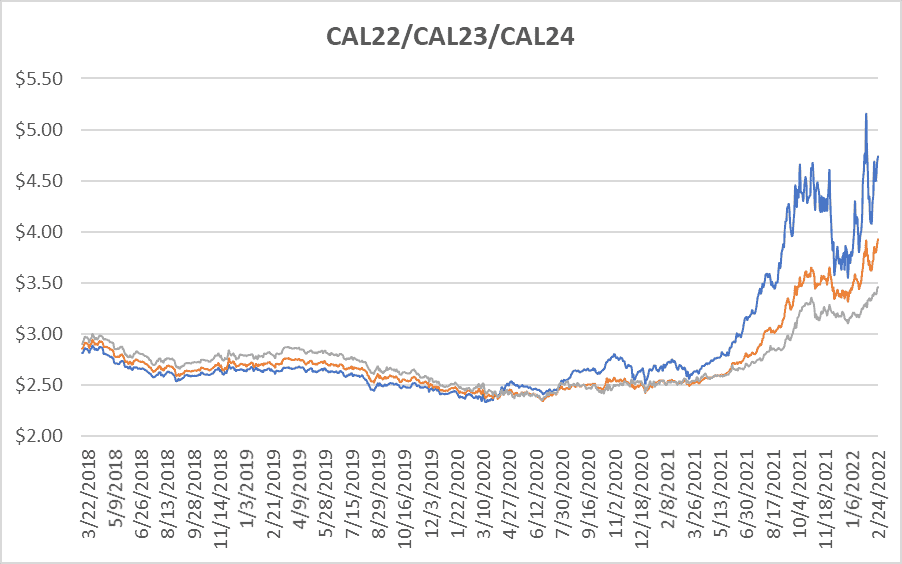
CY22 settled Thursday at $4.742/Dth, up 18.7 cents from the prior week.
CY23 settled Thursday at $3.933/Dth, up 11.1 cents from the prior week.
CY24 settled Thursday at $3.463/Dth, up 7.0 cents from the prior week.
Crude Oil
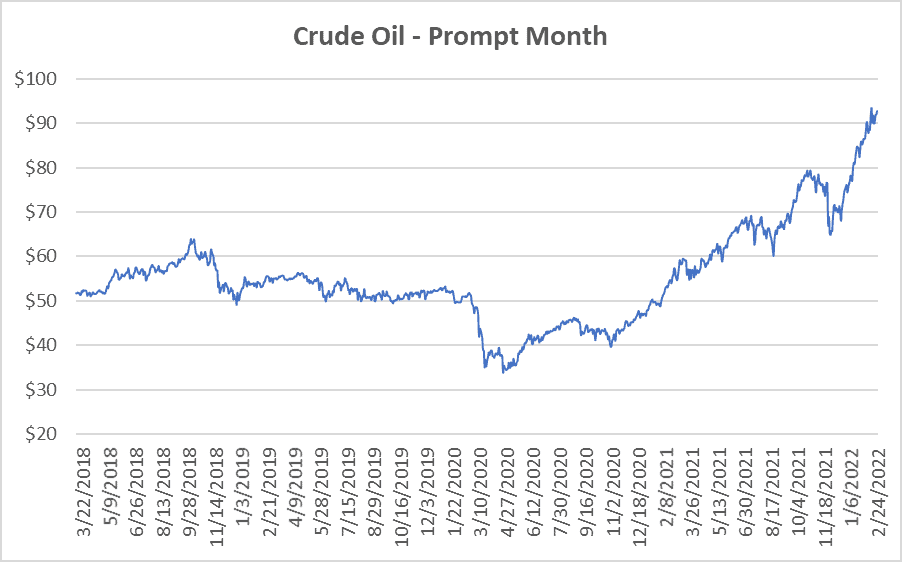
Settled Thursday at $92.81/barrel, up $2.77 from the prior week.
Need Help Making Sense of Natural Gas Prices?
Give us a call. We can help you manage risk and navigate the current price volatility.
We’ll evaluate your current contract and explore your natural gas buying options.
Call us at 866-646-7322 for a no-cost, no-obligation analysis today.
