Natural Gas Price Analysis
The headline for natural gas report week, September 30, 2021 is most certainly the upward price movement, particularly in the two days leading up to the close of October trading on Tuesday. Prompt month prices called cautious last Friday shot upward on Monday, barely blinking at $5.00 before breaking $6.00 on Tuesday, and finally closing the closing the month at $5.841. Of note, that’s the highest October close since 2008.
Fundamental Answers?
If you’re looking for an explanation, it’s unlikely fundamentals are going to give you a satisfying answer. Overall supply remained steady, averaging 98.0 Bcf/d. What’s more is that overall demand dropped 5.7% week-over-week with power generation demand falling 4.3 Bcf/d to 28.7 Bcf/d. This week’s injection of 88 Bcf exceeded both last year’s injection of 74 Bcf and the five-year average of 72 Bcf.
As it stands, if the rate of injections into storage merely kept pace with the five-year average, we’d conclude injection season with 3,506 Bcf – just 213 Bcf short of the five-year average. Analysts expect that deficit will be erased with above-average injections expected for the next six weeks.
Global Markets
With a favorable close to injection season on the horizon, it doesn’t seem storage levels vis-a-vis proximity to winter are the primary driver of recent market activity. Experts seem to be converging around the thought that foreign markets have U.S. investors feeling a little bullish.
Driven by low storage inventories and increasing consumption throughout Europe and Asia, “Gas prices in Europe and Asia traded about four times over U.S. gas…” Absent an explanation in fundamentals, it’s probable U.S. markets moved to keep pace with global prices. Although foreign storage shortfalls translate to a favorable outlook for U.S. LNG exports, this specific potential is limited since U.S. LNG export capacity is nearly maxed out.
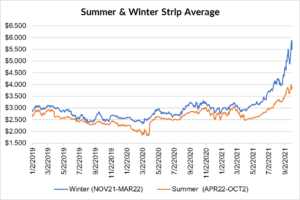
DEC21, settled at $5.991/Dth, up 83.4 cents
JAN22, settled at $6.073/Dth, up 84.1 cents
FEB22, settled at $5.951/Dth, up 81.9 cents
MAR22, settled at $5.517/Dth up 72.4 cents
APR22, settled at $3.996/Dth up 17.7 cents
November NYMEX
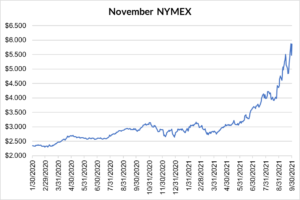
November NYMEX: Settled Thursday at $5.867/Dth up 39.0 cents from Wednesday’s close at $5.477/Dth.
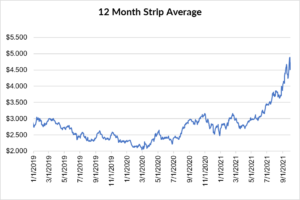
12 Month Strip
Seasonal Strips
Calendar Years 2022/2023
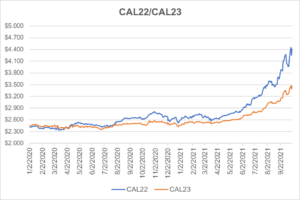
CY23 settled Thursday at $3.469/Dth, up 12.6 cents from the prior week.
If prices have you uneasy, give us a call. We can help you manage risk and navigate the current price volatility.
We can help you evaluate your current contract and explore your natural gas buying options. Call us at 866-646-7322 for a no-cost, no-obligation analysis today.