
For natural gas report week October 8, 2020, the EIA reported a net increase in storage of 75 Bcf. The build was in line with forecasts of injections ranging from 67 Bcf to 85 Bcf, averaging 71 Bcf. Last year for the same week there was an injection of 102 Bcf and the five-year average is 86 Bcf.
Working gas in storage was 3,831 Bcf as of Friday, October 2nd, 2020 per EIA estimates. Inventory was 444 Bcf (13.1%) higher than last year for the same week and 394 Bcf (11.5%) more than the five-year average of 3,437 Bcf.
Natural Gas Market Recap
November NYMEX
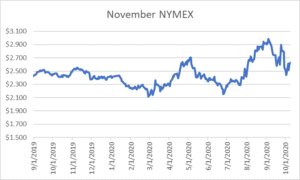
Settled Thursday at $2.627/Dth, up 2.1 cents from Wednesday’s close at $2.606/Dth.
12 Month Strip
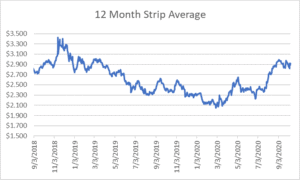
Settled Thursday at $2.919/Dth, up 1.8 cents from the prior week.
Seasonal Strip
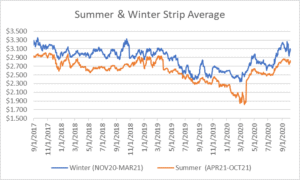
The winter strip (NOV20-MAR21) settled Thursday at $3.096/Dth, up 9.5 cents from the week prior. Looking forward to next summer (APR21-OCT21), the strip settled Thursday at $2.827/Dth, up 5.6 cents from the week prior.
Natural Gas Weekly
Natural Gas Report – October 8, 2020
Natural Gas Fundamentals
Overall supply averaged 91.5 Bcf/d last week as production decreased by 0.02%. Meanwhile, imports from Canada increased by 14.8%.
The average rate of injections into storage is 5% more than that of the five-year average for this point in the refill season. If the injection rate matched the five-year average of 9.9 Bcf/d through the end of refill season (October 31st), withdrawal season would begin with 4,117 Bcf in storage, which is 394 Bcf higher than the five-year average of 3,723 Bcf.
Total demand grew by 6.9% from the prior report week, averaging 84.0 Bcf/d. Residential-commercial demand grew by a considerable 49.3% upon increased consumption for heating. Consumption for power generation fell by 2.1% Industrial demand increased by 2.0% while exports to Mexico fell by 6.7%.
LNG pipeline receipts are up by 0.8 Bcf/d. Fourteen LNG vessels with a combined carrying capacity of 52 Bcf departed the U.S. between October 1 and October 7, 2020.
The number of rigs in operation remained steady at 317 according to data from Enverus. Baker Hughes rig data shows natural gas specific rigs dropped by one from last week, down to 74.
Natural Gas Prices
Henry Hub spot prices increased 55 cents across the report week (from $1.48 MMBtu to $2.03 MMBtu). Prompt month and futures contracts also posted modest gains. Some price response is attributed to below average temperatures and the approach of Hurricane Delta’s landfall on Friday. As of Wednesday, 49% of the natural gas and 80% of the crude oil in the Gulf of Mexico has been shut-in. Additionally, several natural gas pipelines in the region declared force majeure according to Natural Gas Intelligence.
Looking forward, the EIA expects rising domestic winter demand, combined with reduced production, to cause Henry Hub spot prices to rise to a monthly average of $3.38/MMBtu in January 2021. EIA winter price forecasts suggest prices will remain above $3.00/MMBtu throughout 2021.
EIA Short Term Energy and Winter Fuels Outlook
- Based on NOAA winter forecasts alluding to colder winter temperatures, the EIA anticipates residential natural gas expenses will increase by 6% and electricity by 7%. This forecast is predicated on an estimated 5% increase in heating degree days and continued at-home COVID-mitigation efforts, specifically when it comes to remote working and schooling. The EIA did note the unprecedented uncertainty in their forecast due to the constant change in reopening plans.
- The EIA forecasts a record high as natural gas storage inventories will exceed 4.0 Tcf on October 31. Nonetheless, as production is expected to be lower than last winter, withdrawals will likely outpace the five-year average. Projections for the end of withdrawal season (March 2021) put storage at roughly 1.7 Tcf – 6% lower than the 2016–20 average.
- Consumption will average 83.7 Bcf/d through the end of 2020, down 1.8% from 2019. In 2021, EIA expects consumption will average 78.7 Bcf/d, down 5.9% from 2020. This is attributed to rising natural gas prices that will reduce demand for natural gas used in power generation.
- For the remainder of 2020, the EIA expects production will average 90.6 Bcf/d, down from an average of 93.1 Bcf/d in 2019. The EIA indicates the downward trend is expected continue through May 2021 as low crude oil prices will reduce associated natural gas output from oil-directed rigs. Monthly average production is projected to fall from a record 97.0 Bcf/d in December 2019 to 85.9 Bcf/d in May 2021 when higher natural gas and crude oil prices prompt increased production.