
Natural Gas Storage Summary
For natural gas report week October 22, 2020, the EIA reported a net increase in storage of 49 Bcf. The build was in line with forecasts of injections ranging from 44 Bcf to 68 Bcf, averaging 50 Bcf. Last year for the same week there was an injection of 92 Bcf and the five-year average is 75 Bcf.
Working gas in storage was 3,926 Bcf as of Friday, October 16, 2020 per EIA estimates. Inventory was 345 Bcf (9.6%) higher than last year for the same week and 327 Bcf (9.1%) more than the five-year average of 3,599 Bcf.
Natural Gas Market Recap
November NYMEX
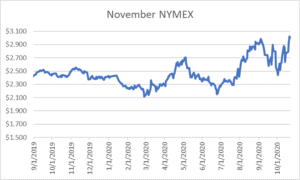
Settled Thursday at $3.007/Dth, down 1.6 cents from Wednesday’s close at $3.023/Dth.
12 Month Strip
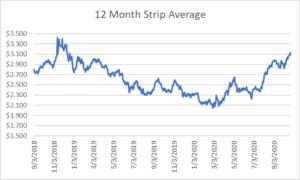
Settled Thursday at $3.089/Dth, up 3.7 cents from the prior week.
Seasonal Strips
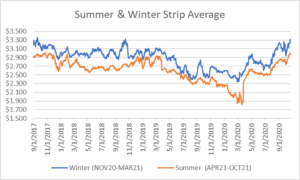
The winter strip (NOV20-MAR21) settled Thursday at $3.254/Dth, up 5.0 cents from the week prior. Looking forward to next summer (APR21-OCT21), the strip settled Thursday at $2.971/Dth, up 2.8 cents from the week prior.
Natural Gas Weekly
Natural Gas Report – October 22, 2020
Natural Gas Fundamentals
Overall supply averaged 92.0 Bcf/d last week as production increased by 3.1%. Meanwhile, imports from Canada decreased by 12.9%.
The average rate of injections into storage is 1% more than that of the five-year average for this point in the refill season. If the injection rate matched the five-year average of 8.2 Bcf/d through the end of refill season (October 31st), withdrawal season would begin with 4,050 Bcf in storage, which is 327 Bcf higher than the five-year average of 3,723 Bcf.
Total demand grew by 8.3% from the prior report week, averaging 87.7 Bcf/d. Residential-commercial demand grew by a considerable 52.3% upon increased consumption for heating. Consumption for power generation fell by 4.1% Industrial demand increased by 3.9% while exports to Mexico fell by 1.0%.
LNG pipeline receipts are up by 1.2 Bcf/d. Fourteen LNG vessels with a combined carrying capacity of 51 Bcf departed the U.S. between October 15 and October 21, 2020.
The number of rigs in operation increased by six, up to 329 according to data from Enverus. Baker Hughes rig data shows natural gas specific rigs increased by one from last week, up to 74.
Natural Gas Prices
Overall spot price activity was mixed on cooler temperatures throughout the Midwest and seasonal temperatures covering the rest of the country. Of note, Henry Hub spot prices increased 83 cents from last Wednesday ($2.03/MMBtu to a high of $2.86/MMBtu on the 21st). Additionally, Permian Basin Waha Hub prices averaged $0.89/MMBtu on Wednesday after hitting a low of -$0.32/MMBtu on Friday.
On Wednesday, November settled at $3.023/Dth, the first time the prompt month broke the $3-mark since January 2019. The backwardated market (Cal ‘21, $3.066/Dth; Cal ’22, $2.914/Dth; Cal ’23, $2.561/Dth; Cal ’24, $2.505/Dth at the time of this writing) suggests two sentiments that are both predictable given the time of year and consistent with activity throughout 2020.
Prices are tied to temperature and storage/production fundamentals. Even though we’re on track to end withdrawal season at a surplus to the five-year average, production has and will continued to remain well below 2019 totals until the middle of 2021. Declining production, even with normal winter temperatures, generally proves bullish the closer we are to winter. Confidence that production will rebound as expected is seen in Cal ’22 – Cal ’24 prices.
Residential-Commercial Winter Natural Gas Demand Outlook
It doesn’t seem possible that November is right around the corner – especially with regional temperatures in the 70s today. If you require convincing, a look at next week’s forecasts should do the trick.
With NOAA winter weather projections forecasting above-average temperatures for much of the southern U.S. and cooler weather for the North, the EIA estimates residential-commercial (rescom) natural gas consumption will exceed last year’s totals. This is due, in part, to expectations for a modest increase in heating degree days from 572 last year to 602 this year. Continued COVID-19 control efforts are also anticipated to drive rescom consumption. According to EIA winter natural gas demand forecasts, “Despite lower prices, EIA forecasts higher residential natural gas consumption will lead to an increase in household expenditures for homes that primarily heat with natural gas. EIA forecasts average household expenditures for these homes will rise to $572 this winter, an increase of $32 (5.9%) compared with last winter.”