
Natural Gas Storage Summary
For natural gas report week October 1, 2020, the EIA reported a net increase in storage of 76 Bcf. The build was in line with forecasts of injections ranging from 71 Bcf to 86 Bcf, averaging 77 Bcf. Last year for the same week there was an injection of 109 Bcf and the five-year average is 78 Bcf.
Working gas in storage was 3,765 Bcf as of Friday, September 25th, 2020 per EIA estimates. Inventory was 471 Bcf (14.3%) higher than last year for the same week and 405 Bcf (12.1%) more than the five-year average of 3,351 Bcf.
Natural Gas Market Recap
November NYMEX
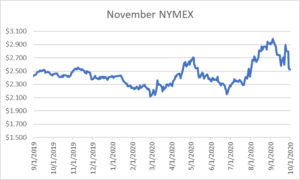
November NYMEX: Settled Thursday at $2.527/Dth, unchanged from Wednesday’s close.
October NYMEX: Moved off the board Monday, September 28th, settling the month at $2.101/Dth.
12 Month Strip
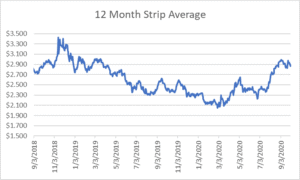
Settled Thursday at $2.867/Dth, down 10.6 cents from the prior week.
Seasonal Strip
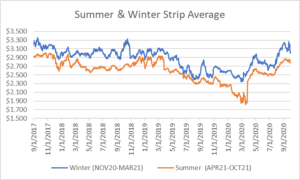
The winter strip (NOV20-MAR21) settled Thursday at $3.001/Dth, down 26.4 cents from the week prior. Looking forward to next summer (APR21-OCT21), the strip settled Thursday at $2.771/Dth, down 8.5 cents from the week prior.
Natural Gas Weekly
Natural Gas Report – October 1, 2020
Natural Gas Fundamentals
Overall supply averaged 91.1 Bcf/d last week as production grew by 0.03%. Meanwhile, imports from Canada increased by 7.5%.
The average rate of injections into storage is 6% more than that of the five-year average for this point in the refill season. If the injection rate matched the five-year average of 10.3 Bcf/d through the end of refill season (October 31st), withdrawal season would begin with 4,128 Bcf in storage, which is 405 Bcf higher than the five-year average of 3,723 Bcf.
Total demand grew by 0.4% from the prior report week, averaging 79.3 Bcf/d. Consumption for power generation grew by 3.8% while residential-commercial demand fell by 7.5%. Industrial demand and exports to Mexico fell by 0.5% and 1.5% respectively.
LNG pipeline receipts are up by 0.45 Bcf/d. Fourteen LNG vessels with a combined carrying capacity of 50 Bcf departed the U.S. between September 24 and September 30, 2020.
The number of rigs in operation increased by twenty, up to 317 according to data from Enverus. Baker Hughes rig data shows natural gas specific rigs increased by two from last week, up to 75.
Natural Gas Prices
November became the prompt month, closing the books on a volatile October. Marked by an 82-cent trading range amid COVID demand recovery, investor driven cuts to productions, and a stabilizing economy, analysts have turned their attention to the approach of winter heating season.
Although the last week brought cool temperatures to punctuate the end of summer, the NOAA 8-14 day forecast predicts above-average temperatures for the entire country. At the same time, well counts increased again this week, signaling an intention to ramp up production.
The warmer weather combined with increasing production will increase the likelihood that injection season will conclude at a healthy surplus to the five-year average. Will this subdue the price volatility experienced in October? As winter-weather forecasts and LNG export opportunities become more defined, market response will follow.
EIA Natural Gas Annual
This Wednesday the EIA released their natural gas annual for 2019. Some interesting highlights include:
– While all other demand sectors generally remained flat from 2018 to 2019, consumption for power generation increased 6.8%, averaging 31.0 Bcf/d. The trend marks the highest for any year since tracking began in 1997. In large part a measure of affordability, natural gas (38.4%) outpaced coal (23.5%) and nuclear (19.7%) in power generation share in 2019.
– For the fourth year in a row, the U.S. was a net exporter of natural gas, exporting 1,915 Bcf (5.2 Bcf/d) more than it imported for the year. U.S. natural gas imports decreased for the second consecutive year. In 2019, exports totaled 4,656 Bcf (12.8 Bcf/d), up 29.1% from 2018. The 2019 annual total was the highest on record, dating back to 1973.
Read the rest of the EIA Natural Gas Annual 2019.