
Natural Gas Storage Summary
For natural gas report week September 24, 2020, the EIA reported a net increase in storage of 66 Bcf. The build was in line with forecasts of injections ranging from 65 Bcf to 86 Bcf, averaging 75 Bcf. Last year for the same week there was an injection of 97 Bcf and the five-year average is 80 Bcf.
Working gas in storage was 3,680 Bcf as of Friday, September 18th, 2020 per EIA estimates. Inventory was 504 Bcf (15.9%) higher than last year for the same week and 407 Bcf (12.4%) more than the five-year average of 3,273 Bcf.
Natural Gas Market Recap
October NYMEX
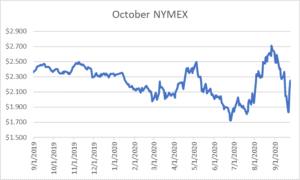
Settled Thursday at $2.248/Dth up 12.3 cents from Wednesday’s close at $2.125/Dth.
12 Month Strip
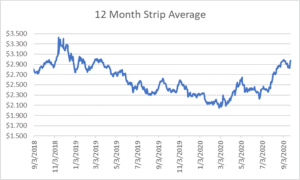
Settled Thursday at $2.973/Dth, up 13.7 cents from the prior week.
Seasonal Strips
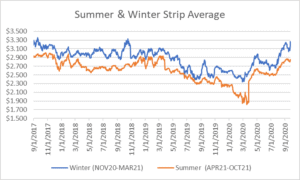
The winter strip (NOV20-MAR21) settled Thursday at $3.265/Dth, up 23.2 cents from the week prior. Looking forward to next summer (APR21-OCT21), the strip settled Thursday at $2.856/Dth, up 4.5 cents from the week prior.
Natural Gas Weekly
Natural Gas Report – September 24, 2020
Natural Gas Fundamentals
Overall supply averaged 90.5 Bcf/d last week as production declined by 0.09%. Meanwhile, imports from Canada fell by 10.0%.
The average rate of injections into storage is 6% more than that of the five-year average for this point in the refill season. If the injection rate matched the five-year average of 10.5 Bcf/d through the end of refill season (October 31st), withdrawal season would begin with 4,130 Bcf in storage, which is 407 Bcf higher than the five-year average of 3,723 Bcf.
Total demand grew by 1.0% from the prior report week, averaging 81.0 Bcf/d. Residential-commercial consumption grew by a whopping 27.9% in response to cooler temperatures while power generation demand fell by 6.7%. Industrial demand and exports to Mexico grew by 2.3% and 3.9% respectively.
LNG pipeline receipts are down by 1.0 Bcf/d. Ten LNG vessels with a combined carrying capacity of 37 Bcf departed the U.S. between September 17 and September 23, 2020.
The number of rigs in operation increased by three, up to 297 according to data from Enverus. Baker Hughes rig data shows natural gas specific rigs increased by two from last week, up to 73.
Natural Gas Prices
Even as this week’s injection came in at the low end of expectations, it seems likely we’ll close injection season at a surplus to the five-year average. With substantial supply, the week’s volatility may seem somewhat curious. Tropical storm and hurricane impact notwithstanding, there’s market uncertainty about both short- and long-term forecasts. With winter specifics yet undefined and no signal of early cold on the horizon, analysts have turned to restored LNG demand and low rig counts for a hint as to where prices may go. FX Empire affirmed LNG may indeed be a large factor in where prices go from here. “Looking ahead, improvements in LNG volumes will be the key to whether this market can sustain the rally since the forecasts don’t show weather to be a major factor over the near-term… Basically, it’s going to take sustained LNG export momentum and probably early winter-like temperatures to prevent storage surplus programs [sic] problems.”