
Natural Gas – Week In Review
It’s natural gas report week, March 24, 2022 and there’s one week left in withdrawal season. We’re at the time of year when, typically, temperatures grow warmer, weekly storage withdrawals turn to injections, and prices settle down. But if the last few years have taught us anything, it’s that Typical is a matter for the nostalgic and that Normal may need reevaluation – even when it comes to gas prices.
Normal would have been lower prices at the close of a withdrawal season that will wrap up within the range of the five-year average. It would have also been normal to expect prices to soften on an EIA reported draw of 51 Bcf when analysts expected 60 Bcf. And of late, prices that have moved in tandem with international markets amid apprehension over low European natural gas storage levels should have also fallen as they did this week in Europe.
But that’s not what happened. From spot prices to futures markets, prices are up more than 40.0 cents across the board. Why?
Let’s take a look.
Natural Gas According to Sherlock Holmes
In The Sign of the Four, Sherlock Holmes implored Watson, “How often have I said to you that when you have eliminated the impossible, whatever remains, however improbable, must be the truth? We know that he did not come through the door, the window, or the chimney. We also know that he could not have been concealed in the room, as there is no concealment possible. Whence, then, did he come?”
While something of a simplification, consider the following image depicting the relationship between the factors that impact natural gas prices:
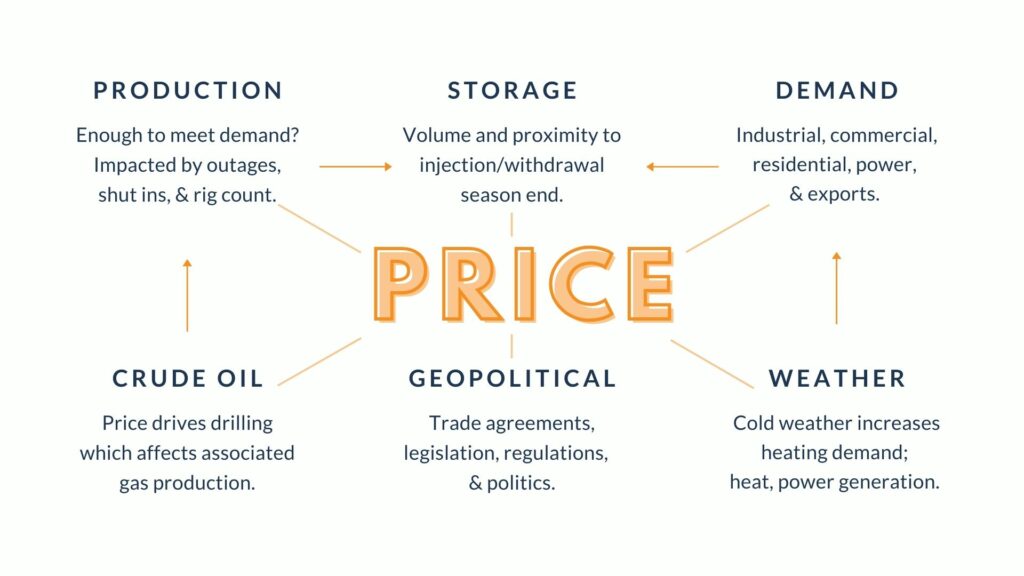
Price Factors: Natural Gas Report Week March 24, 2022
Production – No. Production has been steadily returning to pre-pandemic levels and the EIA expects this trend to continue. Last week, dry production averaged 94.0 Bcf/d. Last year at this time, it averaged 91.8 Bcf/d.
Storage – No. As of the most recent EIA numbers, storage was 366 Bcf less than last year at this time and 293 Bcf below the five-year average of 1,682 Bcf. If the deficit to the five-year average were at the beginning of withdrawal season instead of at the end, there’d be a greater likelihood it would push prices higher. With injection season just days away and storage totals still within the five-year range, this isn’t an imposing influence.
Demand – Also unlikely. This part of shoulder season starts to warm up, cutting heating demand but not so much that it trades off with cooling-related power generation. Last week demand averaged 93.9 Bcf/d, last week it was 110.4 Bcf/d, and last year at this time it was 101.9 Bcf/d.
Crude Oil – Unlikely. When crude prices go up so do profits which incentivizes production. Higher oil production leads to more associated natural gas which is captured through the drilling process. The more supply, the less upward price pressure. Historically, the inverse relationship between oil and natural gas prices has remained consistent.
Geopolitical – Improbable. Although there’s no shortage of geopolitical upheaval, there are a couple of things that make this unlikely. Since late fall, when international natural gas markets went up, so domestic prices followed. And in recent weeks, that tether started to dissolve. While international markets remained high, domestic natural gas prices remained indifferent to both foreign markets as well as international tension. Nonetheless, this week international prices also softened on promises of additional U.S. deliveries. So all things considered, geopolitical factors don’t offer a compelling explanation. It may be an aggravating factor, but it is not The Factor.
Weather – This brings us to Sherlock’s premise. In this case, eliminating the impossible leaves us with our most likely suspect, even though it seems improbable this late in March.
Natural Gas Market Report – March 24, 2022
April NYMEX
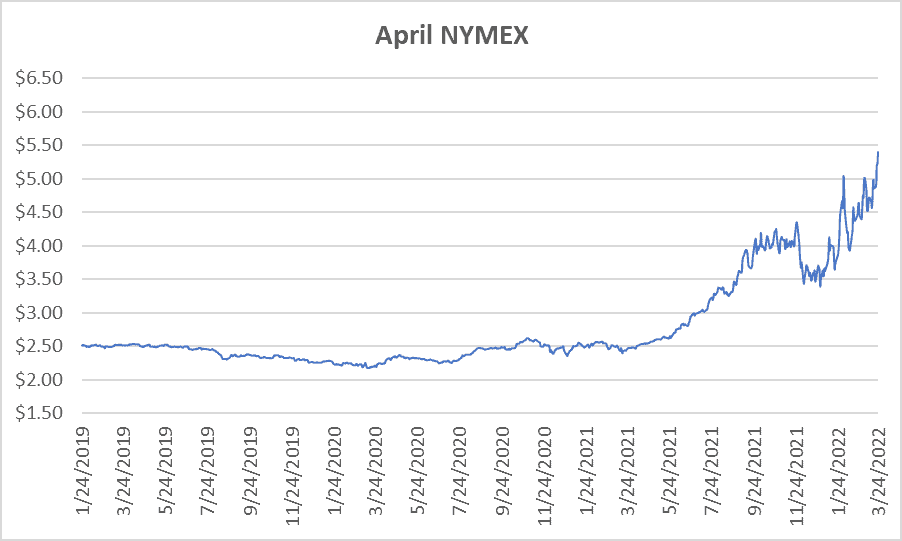
April settled Thursday at $5.401/Dth, up 16.9 cents from Wednesday’s close at $5.232/Dth, and up 41.1 cents over the prior week.
12 Month Strip
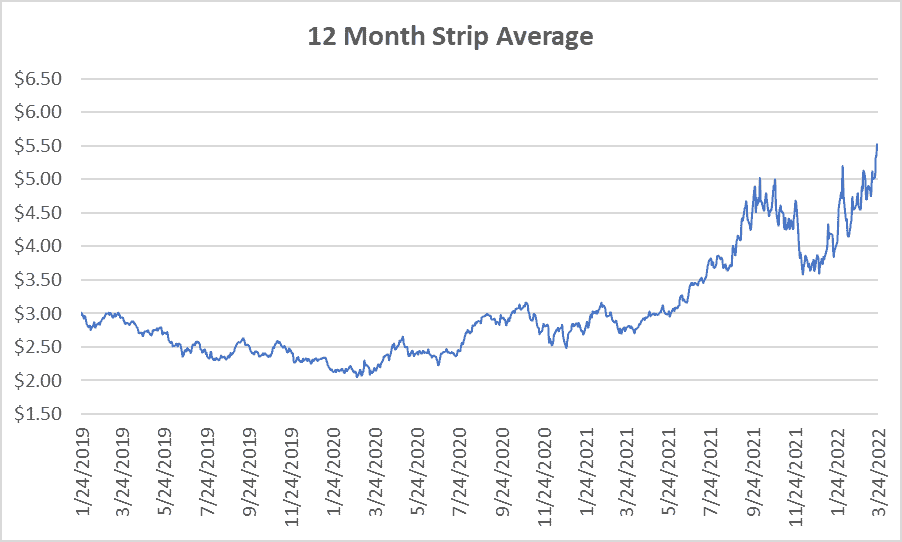
Settled Thursday at $5.519/Dth, up 40.4 cents from the prior week.
Seasonal Strips
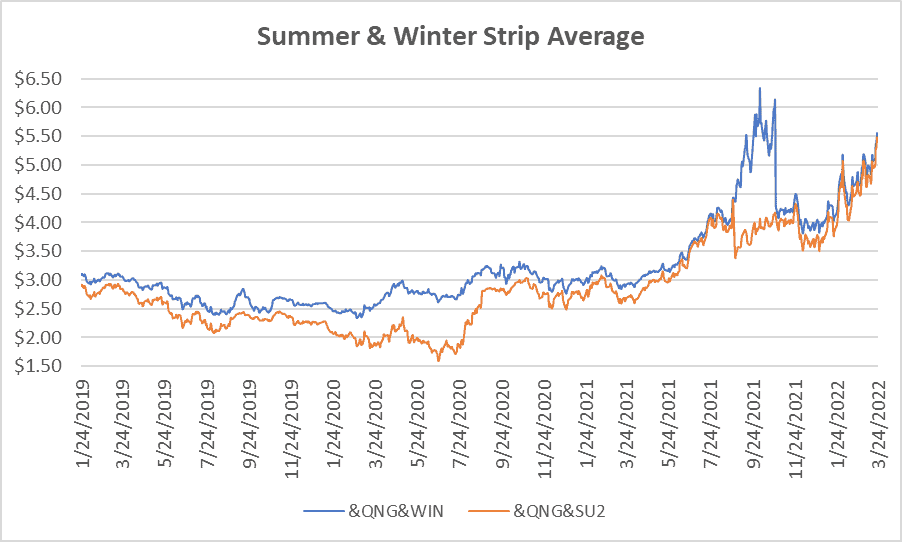
The summer strip (APR22-OCT22) settled at $5.495/Dth, up 42.1 cents from the week prior.
The winter forward (NOV22-MAR23) settled Thursday at $5.554/Dth, up 38.2 cents from the week prior.
Calendar Years 2022/2023/2024
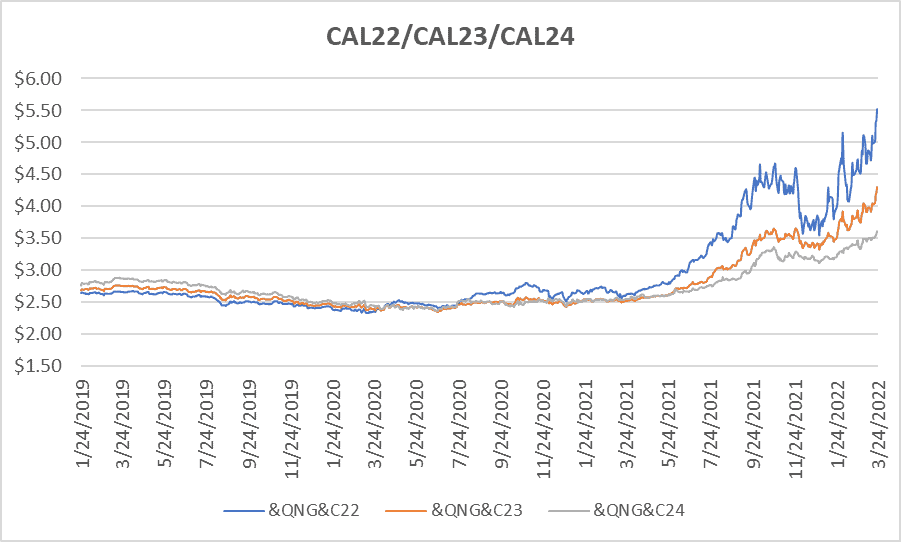
CY22 settled Thursday at $5.530/Dth, up 41.6 cents from the prior week.
CY23 settled Thursday at $4.300/Dth, up 25.2 cents from the prior week.
CY24 settled Thursday at $3.609/Dth, up 10.2 cents from the prior week.
Crude Oil
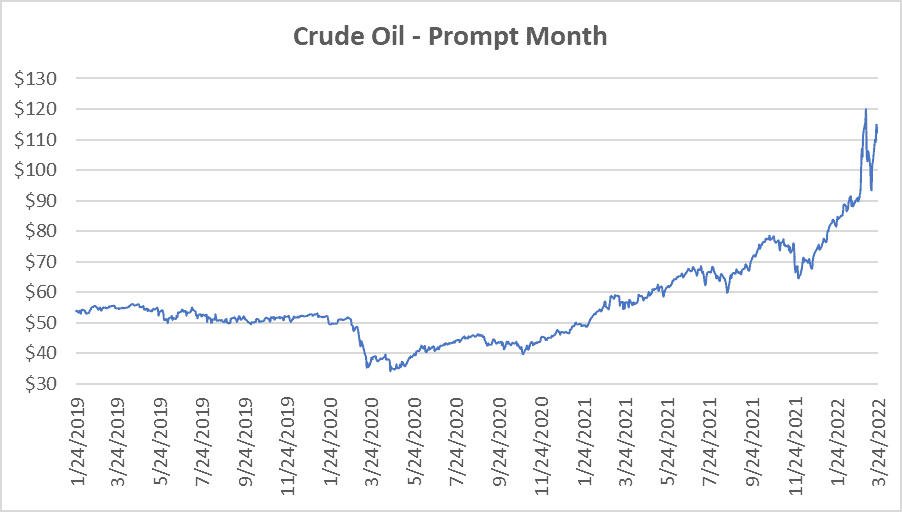
Settled Thursday at $112.34/barrel, up $10.69 from the prior week.
Need Help Making Sense of Natural Gas Prices?
Give us a call. We can help you manage risk and navigate the current price volatility.
We’ll evaluate your current contract and explore your natural gas buying options.
Call us at 866-646-7322 for a no-cost, no-obligation analysis today.