
Natural Gas – Week In Review
Natural gas report week, March 31, 2022. This week April moved off the board at $5.336/Dth, the highest April close since 2008 when the month settled at $9.578/Dth. May, now the prompt month, has shown no signs of losing steam, opening today at $5.62/Dth.
This week also brought the first injection of the season, with the EIA posting an addition of 26 Bcf to storage. Nonetheless, current storage totals are 20% lower than last year at this time and 15% lower than the five-year average.
Prices across the board were on the rise, which warrants a closer look at the fundamentals that most impacted market movement last week.
Let’s take a look.
Price Factors: Natural Gas Report Week March 31, 2022
This week’s 26 Bcf injection would make it seem as though demand abated sufficiently to allow for production to outpace demand. But that’s not what happened.
While demand was up in nearly every sector, it was continued chilly weather that drove heating related demand. Up 39% over last week, residential-commercial demand grew by 8.3 Bcf/d. Even LNG pipeline receipts, which have hovered near capacity for months, eeked out a bit more demand. Overall, U.S. consumption totaled 103.9 Bcf/d, up 10.8 Bcf/d from last week.
Looking to next week, below average temperatures are expected to remain for the eastern half of the United States. Should forecasts hold, expect continued upward price pressure. Also keep an eye on Europe as increasing supply concerns may reignite domestic prices.
Natural Gas Market Report – March 31, 2022
May NYMEX
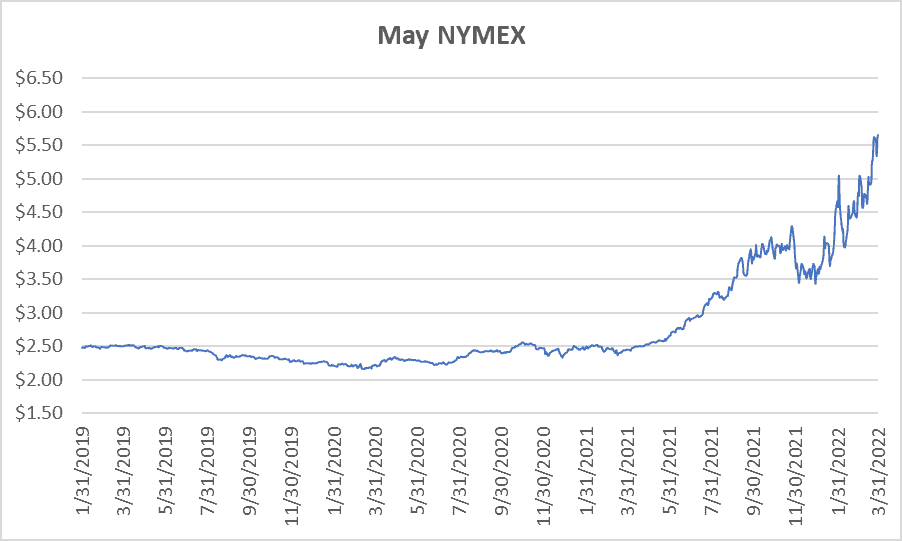
April moved off the board Tuesday, March 29th, settling the month at $5.336/Dth.
May settled Thursday at $5.642/Dth, up 3.7 cents from Wednesday’s close at $5.605/Dth, and up 19.6 cents over the prior week.
12 Month Strip
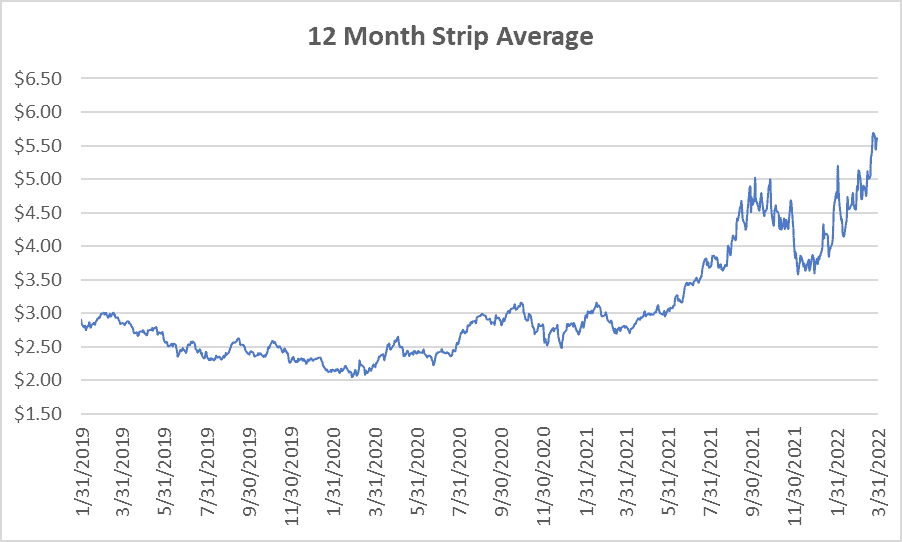
Settled Thursday at $5.607/Dth, up 8.8 cents from the prior week.
Seasonal Strips
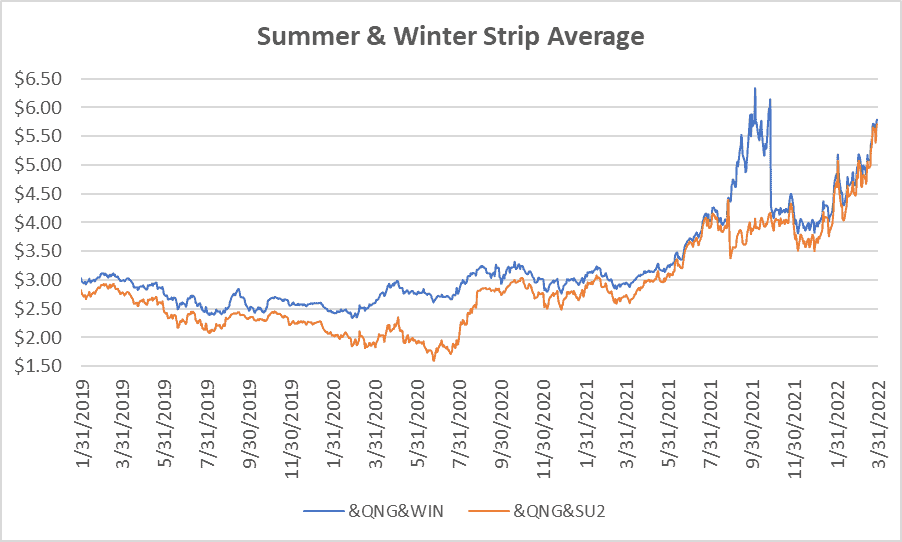
The summer strip (APR22-OCT22) settled at $5.721/Dth, up 22.6 cents from the week prior.
The winter forward (NOV22-MAR23) settled Thursday at $5.785/Dth, up 23.1 cents from the week prior.
Calendar Years 2022/2023/2024
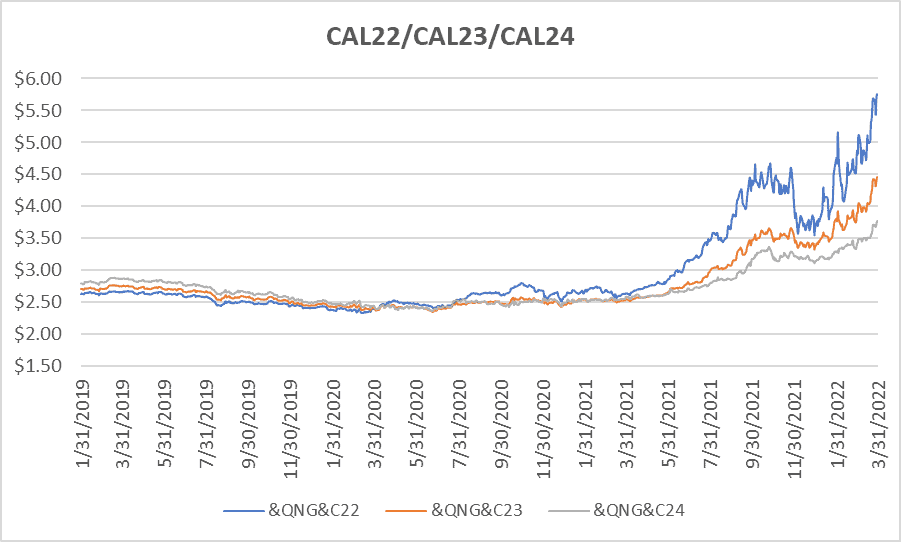
CY22 settled Thursday at $5.761/Dth, up 23.1 cents from the prior week.
CY23 settled Thursday at $4.452/Dth, up 15.2 cents from the prior week.
CY24 settled Thursday at $3.766/Dth, up 15.7 cents from the prior week.
Crude Oil
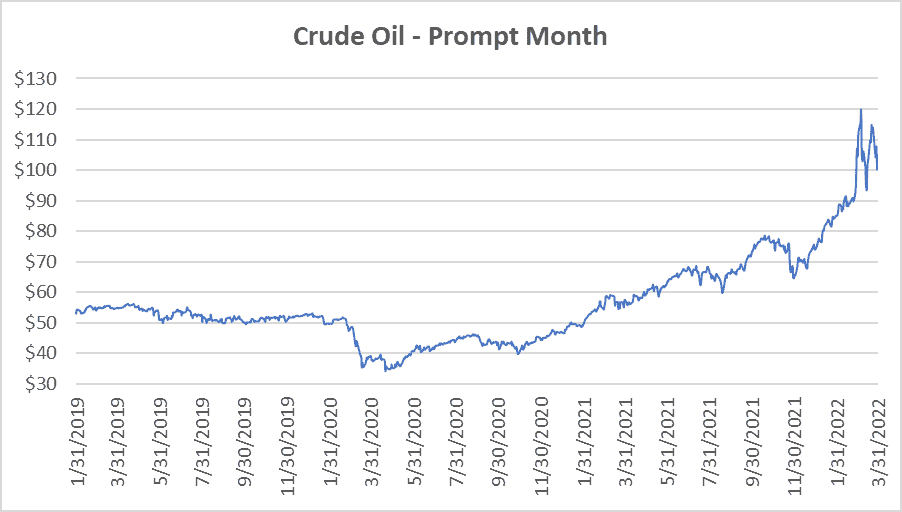
Settled Thursday at $100.28/barrel, down $12.06 from the prior week.
Need Help Making Sense of Natural Gas Prices?
Give us a call. We can help you manage risk and navigate the current price volatility.
We’ll evaluate your current contract and explore your natural gas buying options.
Call us at 866-646-7322 for a no-cost, no-obligation analysis today.