
Natural Gas Storage
For natural gas report week, March 12, 2020, the EIA reported a net decrease in storage of 48 Bcf, in line with projections ranging from a withdrawal of 45 Bcf to a draw of 66 Bcf. Last year for the same week there was a withdrawal of 164 Bcf and the five-year average is a withdrawal of 99 Bcf.
Working gas in storage was 2,043 Bcf as of Friday, March 6th, 2020 per EIA estimates. Inventory was reported at 796 Bcf (63.8%) higher than last year for the same week and 227 Bcf (12.5%) more than the five-year average of 1,816 Bcf.
Natural Gas Market Recap
April NYMEX
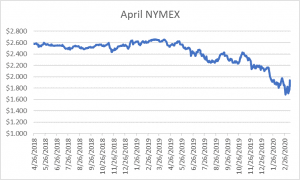
Settled Thursday at $1.841/Dth down 3.7 cents from Wednesday’s close at $1.878/Dth.
12 Month Strip
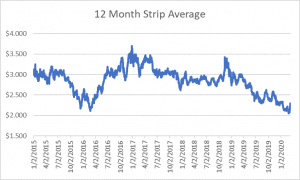
Settled Thursday at $2.222/Dth, up 10.4 cents from last Thursday.
Seasonal Strips
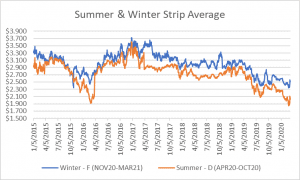
The summer diminishing strip (APR20-OCT20) settled Thursday at $2.020/Dth, up 9.7 cents from the
prior week. The winter forward strip (NOV20- MAR21) settled Thursday at $2.506/Dth, up 11.5 cents from last
Thursday.
Natural Gas Weekly
Natural Gas Report – March 12, 2020
Fundamentals
Overall supply averaged 98.1 Bcf/d last week, down 1.3 Bcf/d from the prior week. Production remained
unchanged while average net imports from Canada fell by 20%. Total demand dropped by 10% from the prior report week. Residential/commercial consumption and power-generation down by 20% and 6%, respectively. Industrial consumption fell by 2% while exports to Mexico were unchanged. LNG exports decreased over last week, down to 14 LNG vessels with a combined carrying capacity of 51 Bcf.
So far this withdrawal season, the average rate of withdrawal is 10% less than the five-year average. If the rate of withdrawal from storage matched the five-year average of 4.7 Bcf/d from now until March 31, storage inventory would be 1,924 Bcf which is 227 Bcf higher than the five-year average of 1,697 Bcf.
Important Trends
While the coronavirus simultaneously drove both volatile market response and frenzied news cycles across the last week, Russia’s refusal of OPEC proposed crude oil production cuts caused a chain reaction of events that added to the ongoing economic strain. Following collapse of negotiations, Saudi Arabia stated their intention to cut oil prices and escalate production. Russia then responded with similar intentions. Then global oil prices fell to their lowest level since February 2016, at the fastest rate in three decades.
That may seem like a great thing for consumers, but it’s not for U.S. oil producers who help make America one of the world’s largest producers of oil. With other major oil producers following the Saudi example and coronavirus-related consumption declines exacting their own toll (compounded by waves of activity and travel cancellations), prices have continued to falter.
Prices remain well below breakeven for producers. With little end in sight for oversupply and subdued demand, it’s likely producers will increasingly turn to production cuts as a follow up to capital spending reductions. Such financial measures have already been taken by Occidental Petroleum and Marathon Oil. Since it’s unlikely producers will shut existing wells, production cuts won’t be realized until the end of 2020 and into 2021.
When it comes to natural gas this matters because a portion of natural gas production is associated gas, or gas that comes from oil wells. Fewer wells will mean lower associated gas production which in turn means lower supply. So for now, production remains steady, but tightening natural gas supply toward the end of 2020 may give prices a boost.