
Natural Gas Storage Summary
For natural gas report week, March 5, 2020, the EIA reported a net decrease in storage of 109 Bcf, in line with projections ranging from a withdrawal of 96 Bcf to a draw of 117 Bcf. Last year for the same week there was a withdrawal of 152 Bcf and the five-year average is a withdrawal of 106 Bcf.
Working gas in storage was 2,091 Bcf as of Friday, February 28th, 2020 per EIA estimates. Inventory was reported at 680 Bcf (48.2%) higher than last year for the same week and 176 Bcf (9.2%) more than the five-year average of 1,915 Bcf.
Natural Gas Market Recap
April NYMEX
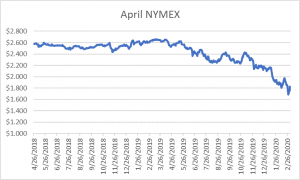
Settled Thursday at $1.772/Dth down 5.5 cents from Wednesday’s close at $1.827/Dth.
12 Month Strip
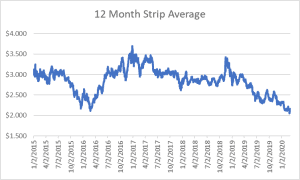
Settled Thursday at $2.118/Dth, up less than a penny from last Thursday.
Seasonal Strips
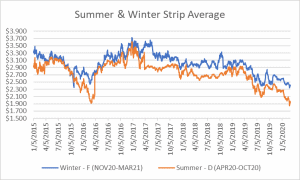
The summer diminishing strip (APR20-OCT20) settled Thursday at $1.923/Dth, up less than a penny
from the prior week. The winter forward strip (NOV20-MAR21) settled Thursday at $2.391/Dth, down less than a penny
from last Thursday.
Natural Gas Weekly
Natural Gas Report – March 5, 2020
Fundamentals
Overall supply averaged 99.4 Bcf/d last week with production unchanged and average net
imports from Canada down by 11%. Total demand dropped by 8% from the prior report week with residential/commercial consumption and power generation down by 14% and 4%, respectively. Industrial consumption fell by 2% while exports to Mexico grew by 3%. LNG exports decreased over last week, down to 15 LNG vessels with a combined carrying capacity of 53 Bcf. So far this withdrawal season, the average rate of withdrawal is 8% less than the five-year average. If the rate of withdrawal from storage matched the five-year average of 6.8 Bcf/d from now until March 31, storage inventory would be 1,873 Bcf which is 176 Bcf higher than the five-year average of 1,697 Bcf.
Important Ohio Energy News
According to a new report by Energy News Network, the effort to pass Ohio HB6 and subsequently prevent the legislation from reaching Ohio voters for consideration was orchestrated by dark money groups. Those groups made over $1 million in campaign contributions to push HB6 through the Ohio General Assembly. Following passage of HB6, they also dumped millions into “misleading ads, alleged harassment of signature collectors, buyouts of petition workers, and even alleged assault,” all aimed at preventing Ohioans from voting on the legislation.
The coordinated effort leaves Ohio ratepayers responsible for paying nearly $1 billion to bail out two of the
bankrupt generator’s nuclear power plants with additional funds set aside for two of their coal plants.
The exact same set of players are also involved in additional legislation before Ohio lawmakers. Consumer groups have argued against HB247, arguing it would strangle the competitive market in Ohio, meaning higher rates for consumers.
Utilities could also charge ratepayers for infrastructure improvements in the name of economic development,
whether or not it would be useful. The legislation would allow utilities to spend “unlimited amounts of money on risky projects with little or no oversight, and no recourse.”