
Natural Gas Storage Summary
For natural gas report week, March 19, 2020, the EIA reported a net decrease in storage of 9 Bcf, in line with projections ranging from a withdrawal of 14 Bcf to an injection of 7 Bcf. Last year for the same week there was a withdrawal of 91 Bcf and the five-year average is a withdrawal of 63 Bcf.
Working gas in storage was 2,034 Bcf as of Friday, March 13th, 2020 per EIA estimates. Inventory was reported at 878 Bcf (76.0%) higher than last year for the same week and 281 Bcf (16.0%) more than the five-year average of 1,753 Bcf.
Natural Gas Market Recap
April NYMEX
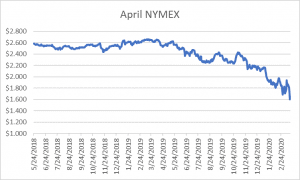
Settled Thursday at $1.654/Dth up 5.0 cents from Wednesday’s close at $1.604/Dth.
12 Month Strip
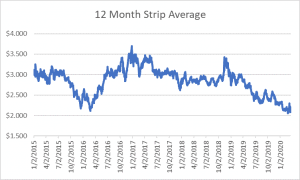
Settled Thursday at $2.149/Dth, down 7.3 cents from last Thursday.
Seasonal Strips
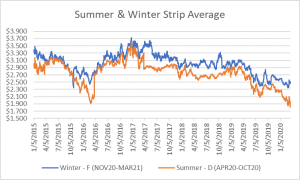
The summer diminishing strip (APR20-OCT20) settled Thursday at $1.890/Dth, down 13.0 cents from the prior week. The winter forward strip (NOV20-MAR21) settled Thursday at $2.511/Dth, down less than a penny from last Thursday.
Natural Gas Weekly
Natural Gas Report – March 19, 2020
Natural Gas Fundamentals
Overall supply averaged 99.0 Bcf/d last week with production up 1% and average net imports from Canada
increased by 12%. Total demand increased by 3% from the prior report week with power-generation and industrial consumption up by 8% and 1%, respectively. Residential/commercial consumption fell by 1% while exports to Mexico grew by 1%. LNG exports increased over last week, up to 16 LNG vessels with a combined carrying capacity of 59 Bcf.
With one week left in withdrawal season, the average rate of withdrawal is 13% less than the five-year average. If the rate of withdrawal from storage matched the five-year average of 3.1 Bcf/d from now until March 31, storage inventory would be 1,978 Bcf which is 281 Bcf higher than the five-year average of 1,697 Bcf.
Natural Gas Prices
Prompt month prices fell nearly 20.0 cents from last week while calendar strips hit new lows. Crude oil ended the week “down 10.7% at $22.53 a barrel. It closed the week with a massive 29% slide, its biggest one-week percentage decline since January 1991. Brent, the global gauge of prices, dropped 20% for the week to $26.98 a barrel,” according to a report by the Wall Street Journal. When the federal government’s announcement of their intention to purchase oil for the Strategic Petroleum Reserve failed to reverse the slide, reports surfaced claiming the U.S may attempt to intervene in the Saudi-Russia oil war. With oversupply impacting crude oil prices, analysts expect decreased oil production may eventually lead to cuts in natural gas supply.
However, as heating season wanes and the impact of COVID-19 closures on declining commercial and industrial demand begin to take shape, the market could see further price declines despite associated natural gas supply concerns.
As producers haven’t yet signaled cuts to production and the full impact to demand is uncertain, the market direction is ultimately another unknown. We will continue to monitor fundamentals and communicate possible impacts to prices.
AES Operational Note
As our businesses confront evolving community health needs and navigate the resulting impacts to the way we conduct business, we are working to ensure the health of our employees and our customers. To this end, in-person business meetings have been replaced with web conferencing and phone meetings. At the same time, we understand the impact uncertainty has on business and want you to know we are here to answer any questions you have about the market or your specific energy program.