
Natural Gas Storage Summary
For natural gas report week, June 4, 2020, the EIA reported a net increase in storage of 102 Bcf. The injection was in line with forecasts of injections ranging from 93 Bcf to 122 Bcf and averaging 109 Bcf. Last year for the same week there was an injection of 118 Bcf and the five-year average is an injection of 103 Bcf.
Working gas in storage was 2,714 Bcf as of Friday, May 29th, 2020 per EIA estimates. Inventory was reported at 762 Bcf (39.0%) higher than last year for the same week and 422 Bcf (18.4%) more than the five-year average of 2,292 Bcf.
Natural Gas Market Recap
July NYMEX
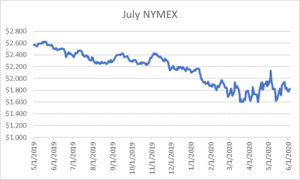
July settled Thursday at $1.822/Dth up less than a penny from Wednesday’s close at $1.821/Dth.
12 Month Strip
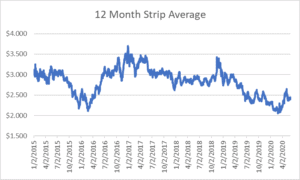
Settled Thursday at $2.431/Dth, up less than a penny from the prior week.
Seasonal Strips
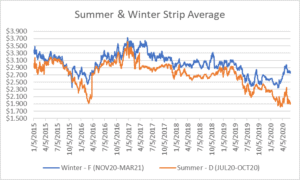
The summer strip (JUL20-OCT20) settled Thursday at $1.940/Dth, down less than a penny from the week prior. The winter strip (NOV20-MAR21) settled at $2.788/Dth, up 2.6 cents from last week.
Natural Gas Weekly
Natural Gas Report – June 4, 2020
Natural Gas Fundamentals
Overall supply averaged 93.9 Bcf/d last week as production grew by 0.5% and imports from Canada increased by 4.7%.
The average rate of injections into storage is 19% more than that of the five-year average for this point in refill season. If the injection rate matched the five-year average of 9.2 Bcf/d through the end of refill season (October 31st), withdrawal season would begin with 4,145 Bcf in storage, which is 422 Bcf higher than the five-year average of 3,723 Bcf.
Total demand increased 3.9% from the prior report week, averaging 79.0 Bcf/d. Residential-commercial consumption decreased by 5.9% and industrial demand fell by 0.3% from last week. Consumption for power generation grew by 10.1%. Exports to Mexico increased by 4.8%. LNG exports decreased, down two LNG vessels to ten with a combined carrying capacity of 36 Bcf.
According to data from Enverus, the total daily rig count fell by 17 from last week, down 5.0% to 322.
Natural Gas Prices
Spot prices rose across the report week amid unseasonably warm temperatures throughout much of the country. Prompt month and strip prices posted minimal week-over-week change with the largest movement occurring in the winter strips which increased by only 2.6 cents.
Of note, nuclear outages nearly doubled last year’s (10.3 GW capacity compared to 5.5 GW in 2019). A large part of the lost capacity is due to the 100% loss from Monroe’s Fermi plant. In early May, an outbreak of COVID-19 cases prompted a safety stand down that led to the delay of planned maintenance and refueling. According to a representative from Local 687, by mid-May more than 10% of the plant’s 2,000+ workforce had confirmed cases.
DTE Energy implemented changes to assure the health of employees and safeguard continued operations which allowed some work to resume quickly. Nonetheless, the outage is still expected to last 83 days from start to finish. According to S&P, “The average duration of refueling outages at US nuclear units in 2019 was 36.2 days.”
Ultimately, the nuclear shortfall led to an increased demand for natural gas used for power generation which likely helped prices.
Finally, Tropical Storm Cristobal has spawned warnings for the U.S. Gulf Coast for Sunday through Monday. Even as the track has become more defined, the storm’s strength at landfall remains an unknown. Should the storm gather steam, it may put additional upward pressure on prices.
LNG, The Jones Act, and Puerto Rico –
Hurricane Maria exposed the vulnerabilities of Puerto Rico’s power grid. It was 11 months before power was fully restored to the island. Even still, the integrity of their power supply remains in question. The aid they received from FEMA went to repairs and left the system still in need of major upgrades. With the Puerto Rico Electric Power Authority (PREPA) confronting economic instability and completion of a grid overhaul years away, leadership has established ambitious goals to transition to 100% renewable by 2050.
In the interim, natural gas will play a key part in Puerto Rico’s energy mix. According to the EIA, “For fiscal year 2019, petroleum fueled 40% of Puerto Rico’s total electricity generation and natural gas accounted for 39%. Coal continued to fuel 18% of generation, while renewables supplied 2.3%.” With a substantial U.S. LNG surplus, you might be surprised to find Puerto Rico’s LNG “is imported mostly from Trinidad and Tobago.”
Why? The Jones Act.
According to the New York Times, The Merchant Marine Act of 1920, known as the Jones Act, requires goods shipped between points in the United States to be carried by vessels built, owned and (mostly) operated by Americans. The acts opponents maintain it results in higher costs passed along to consumers. In 2017 President Trump temporarily waived the act for Puerto Rico as a part of post-hurricane relief efforts.
This week, Utah Senator Mike Lee picked up the torch of late Arizona Senator John McCain who was an outspoken critic of the act. “It’s not because of a shortage of LNG in the United States, but rather because there are only so many Jones Act-compliant vessels capable of handling LNG shipments along coastlines — and not one of them happens to be US-flagged, US-crewed or US-built. So, we don’t just empower bad regimes, but also impoverish American citizens,” Lee stated.
U.S. oil and gas exporters are looking to policy shifts to help the struggling industries compete with foreign countries who can afford to ship at a lower cost. To this end, repeal of the Jones Act has started to pick up support.