
For natural gas report week, June 11, 2020, the EIA reported a net increase in storage of 93 Bcf. The build was in line with forecasts of injections ranging from 84 Bcf to 99 Bcf, averaging 93 Bcf. Last year for the same week there was an injection of 107 Bcf and the five-year average is an injection of 94 Bcf.
Working gas in storage was 2,807 Bcf as of Friday, June 5th, 2020 per EIA estimates. Inventory was reported at 748 Bcf (36.3%) higher than last year for the same week and 421 Bcf (17.6%) more than the five-year average of 2,386 Bcf.
Natural Gas Market Recap
May NYMEX
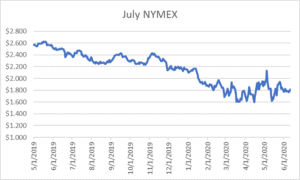
July settled Thursday at $1.813/Dth up 3.3 cents from Wednesday’s close at $1.780/Dth.
12 Month Strip
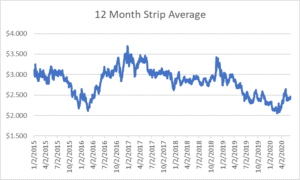
Settled Thursday at $2.461/Dth, up 3.0 cents from the prior week.
Seasonal Strips
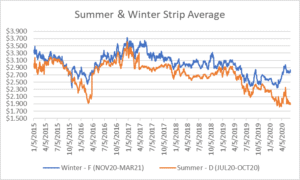
The summer strip (JUL20-OCT20) settled Thursday at $1.928/Dth, down 1.2 cents from the week prior. The winter strip (NOV20-MAR21) settled at $2.842/Dth, up 5.4 cents from last week.
Natural Gas Weekly – Three Things to Watch
Natural Gas Report – June 11, 2020
1. Natural Gas Fundamentals
Overall supply averaged 93.7 Bcf/d last week as production grew by 0.3% while imports from Canada dropped by 7.5%.
The average rate of injection into storage is 16% more than that of the five-year average for this point in the refill season. If the injection rate matched the five-year average of 9.0 Bcf/d through the end of refill season (October 31st), withdrawal season would begin with 4,144 Bcf in storage, which is 421 Bcf higher than the five-year average of 3,723 Bcf.
Total demand grew for a second consecutive week, increasing 3.1% from the prior report week, averaging 79.4 Bcf/d. Consumption for power generation grew by 8.7%. Likewise, exports to Mexico increased by 8.2%. Residential-commercial consumption decreased by 6.4% and industrial demand fell by 1.2%. LNG exports fell by 50%, down five LNG vessels to five with a combined carrying capacity of 18 Bcf. According to the EIA, “This weekly export volume is the lowest since the week of June 8 – June 14, 2017.”
The number of rigs in operation declined for the 13th-straight week, falling below 300 for the first time. The Houston Chronicle reported, “At the worst of the 2014-16 oil bust – the previous lowest point on record — there were 404 rigs operating.” Baker Hughes data shows, as of June 2, natural gas rigs fell by 1 to 76 while oil-directed rigs dropped 16 to 206. The total rig count decreased by 17. It now stands at the lowest point on record at 284.
2. Natural Gas Prices
Last week, “Energy producers shut down almost 35% of the US Gulf of Mexico’s crude oil production and more than 32% of natural gas supplies ahead of Tropical Storm Cristobal,” according to S&P Global Platts. “More than 635,000 b/d of crude and 878 MMcf/d of gas were shut in ahead of Cristobal’s move onshore.” Nonetheless, spot prices generally decreased across the report week. Prompt month/12-month strip prices saw minimal movement. The winter forward strip posted the largest gains, consistent with EIA expectations that prices will remain low through August before rising through the end of 2021. “EIA expects that natural gas price increases will be sharpest this fall and winter when they rise from an average of $2.06/MMBtu in September to $3.08/MMBtu in January.”
3. End-of-Season Record Storage
The EIA’s June Short Term Energy Outlook shows storage levels on March 31, 2020, were 19% higher than the five-year average and almost 74% more than the prior year.
The report forecasts dry production through October 31 will average 88.9 Bcf/d, 4% less than last year. Although lower than 2019 records, production remains high compared to historical numbers. Analysts expect production declines will result in smaller injections for the remainder of the refill season but finds they will still total 1% more than the five-year average. Even with average injections, the high starting storage level will likely lead to a record setting 4,089 Bcf start to withdrawal season. At that level, supplies would fill storage facilities to 96% of their demonstrated peak capacity of 4,261 Bcf.
Overall, consumption is expected to remain steady through the close of injection season. While industrial consumption is forecast to fall almost 12% from 2019, predictions indicate that will be offset by demand increases in other sectors.