
Natural Gas Storage Summary
For natural gas report week, April 16, 2020, the EIA reported a net increase in storage of 73 Bcf, in line with forecasts of injections ranging from 39 Bcf to 78 Bcf. Last year for the same week there was an injection of 73 Bcf and the five-year average is an injection of 27 Bcf.
Working gas in storage was 2,097 Bcf as of Friday, April 10th, 2020 per EIA estimates. Inventory was reported at 876 Bcf (71.7%) higher than last year for the same week and 370 Bcf (21.4%) more than the five-year average of 1,727 Bcf.
Natural Gas Market Recap
May NYMEX
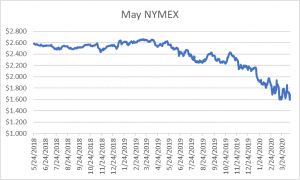
Settled Thursday at $1.686/Dth up 8.8 cents from Wednesday’s close at $1.598/Dth.
12 Month Strip
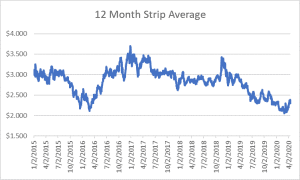
Settled Thursday at $2.356/Dth, down less than a penny from the prior week.
Seasonal Strips
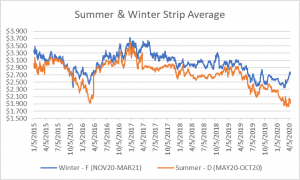
The summer strip (MAY20-OCT20) settled Thursday at $2.010/Dth, down 1.6 cents from the week
prior. The winter strip (NOV20-MAR21) settled at $2.746/Dth, up less than a penny from last week.
Natural Gas Weekly
Natural Gas Report – April 16, 2020
Natural Gas Fundamentals
Overall supply averaged 98.3 Bcf/d last week as production remained unchanged and average net imports from Canada increased by 18%. Total demand increased by 3% from the prior report week with residential-commercial up by 9% due to cooler temperatures. Consumption for power generation and industrial demand remained the same as the prior week, averaging 25.9 Bcf/d and 20.8 Bcf/d, respectively. Exports to Mexico fell by 8% while LNG exports increased from last week, up to 17 LNG vessels with a combined carrying capacity of 61 Bcf.
Natural Gas Prices
Analysts are suggesting that the convergence of factors may yield a spike in natural gas prices. Low crude oil prices have prompted production cuts which will mean lower associated natural gas production. Additional cuts to natural gas production throughout the summer, as forecast by the EIA, may collide with post-virus demand stabilization in approach of winter resulting in higher prices.
A Look Back at Natural Gas Withdrawal Season
According to the EIA, withdrawal season concluded with 2008 Bcf in storage – 19% above than the five-year average. The EIA attributes the higher inventory level to strong production coupled with weak heating demand. While increases in both LNG exports and power burn exceeded the declines in heating related demand, the growth was insufficient to offset record-setting production rates.
Looking forward, the EIA expects production will decline throughout this summer while exports are forecast to grow, resulting in smaller injections. At present, production is 3.0 Bcf/d higher than last year at this time. Early estimates for end-of-season storage totals average 3,904 Bcf which is 185 Bcf above the five-year average and 252 Bcf above last year.