Natural Gas Storage Summary
For natural gas report week, April 23, 2020, the EIA reported a net increase in storage of 43 Bcf, in line with forecasts of injections ranging from 11 Bcf to 51 Bcf and averaging 45 Bcf. Last year for the same week there was an injection of 92 Bcf and the five-year average is an injection of 49 Bcf.
Working gas in storage was 2,140 Bcf as of Friday, April 17th, 2020 per EIA estimates. Inventory was reported at 827 Bcf (63.0%) higher than last year for the same week and 364 Bcf (20.5%) more than the five-year average of 1,776 Bcf.
Natural Gas Market Recap
May NYMEX
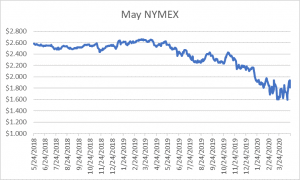
Settled Thursday at $1.815/Dth down 12.4 cents from Wednesday’s close at $1.939/Dth.
12 Month Strip
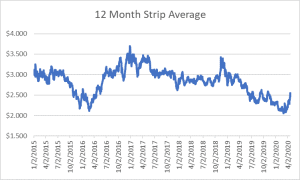
Settled Thursday at $2.483/Dth, up 12.7 cents from the prior week.
Seasonal Strips
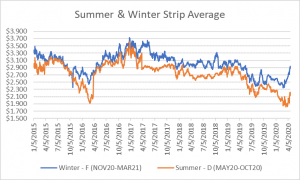
The summer strip (MAY20-OCT20) settled Thursday at $2.137/Dth, up 12.7 cents from the week prior. The winter strip (NOV20-MAR21) settled at $2.881/Dth, up 13.5 cents from last week.
Natural Gas Weekly
Natural Gas Report – April 23, 2020
Natural Gas Fundamentals
Overall supply averaged 97.6 Bcf/d last week as production remained unchanged at 92.5 Bcf/d. Average net imports from Canada decreased by 6%. Total demand fell by 3% from the prior report week with both industrial consumption and power generation down 3% and 6%, respectively. Residential-commercial remained steady, averaging 22.1 Bcf/d.
Exports to Mexico increased by 3% while LNG exports decreased from last week, down 4 LNG vessels to 13 with a combined carrying capacity of 48 Bcf. Of note, China received its first U.S. LNG shipment in more than a year after tariff exemptions made the shipment more cost effective. At the same time, overall demand is down roughly 7% from last year. LNG exports have likewise dropped, with more than a dozen shipments canceled so far this year and another two-dozen expected by June.
Natural Gas Prices
With production steady and storage at a sizable surplus to the five-year average and given evaporating demand in the wake of COVID-19, anticipation of continued low prices would have been reasonable. Yet this week, spot prices rose in most locations. Likewise, prompt month as well as the 12-month, winter, and summer strips were each up more than 12.0 cents from last week.
Current prices for the upcoming winter increase from $2.342 in October 2020 to $3.012 in January 2021. The shift reflects market sentiment that the supply/demand balance will tighten leading up to and through winter. Those expectations are rooted in declines in drilling activity that’s been prompted by low prices.
Natural Gas Drilling Activity
According to Enverus, the daily rig count declined 11% from the prior week, down to 453. As of this week, that’s a 40% decline from last month and a 55% drop, year-over-year. The EIA expects this will result in almost a 5.0 Bcf/d drop in 2020 production levels from 2019 before picking up pace again in the second half of 2021.
The Houston Chronicle reported, “For the first time in more than a decade, U.S. natural gas is set to be the world’s most expensive as Covid-19 lockdowns wallop demand in other regions. Gas futures in the U.S. have rallied about 10% this month as traders bet that a historic crash in oil prices will drive American shale companies to halt more drilling and curb output of gas, which is extracted as a byproduct. In Europe and Asia, meanwhile, prices are sliding to fresh lows due to a supply glut and languishing consumption amid the pandemic.”
As we reported last week, current indicators are signaling a spike in natural gas prices for the start of winter. Given the economic strain introduced by COVID-19, it may be time to reassess your risk tolerance and make a plan in advance of seasonal volatility. We’re here to help.