
Natural Gas Price Analysis
For natural gas report week, September 23, 2021, prices across the board gave up most of their gains from the prior week.
As I wrote a few weeks ago, the market is a fickle thing. In a return to fundamentals, prices softened after a couple weeks of injections that fell at the high end of expectations, cooler temperatures, and a reprieve from Gulf hurricane activity.
It’s possible, too, what we’re seeing now is just a lull in approach of winter price movement. Because realistically, prices might retreat a little, but it won’t be long lived. Natural gas prices don’t go down in winter. So it’s safe to expect that they’re probably going to go up. How much is anyone’s guess.
However, if that risk makes you nervous, it might be time to talk about managing your risk and opportunities beyond winter when the market will most certainly normalize. Give us a call.
Looking Ahead…
Here’s how things are shaping up right now:
Production – Not expected to pick back up until 1Q 2022. However, we’ve been adding oil wells consistently which means more associated gas.
LNG Exports – Overseas prices are high, supplies are low. Expect this to remain strong throughout winter.
Industrial Demand – This will remain linked to economic recovery. Keep an eye on Congressional work to keep the government funded and the Biden Administration’s $3.5 trillion spending bill as these will impact the outcome of economic recovery.
Power Generation – There’s been quite a bit of talk about rising natural gas prices leading to a decreased reliance on natural gas for power generation. Some have suggested that coal would increase in its share of power generation, but as coal supply remains tight, that seems unlikely.
NOV21, settled at $5.043/Dth, down 33.9 cents
DEC21, settled at $5.157/Dth, down 33.5 cents
JAN22, settled at $5.232/Dth, down 33.2 cents
FEB22, settled at $5.132/Dth, down 34.0 cents
MAR22, settled at $4.793/Dth down 30.8 cents
APR22, settled at $3.819/Dth down less than a penny
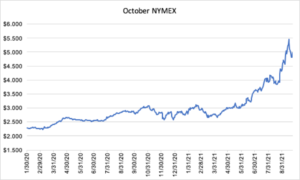
October NYMEX
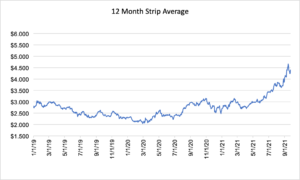
12 Month Strip
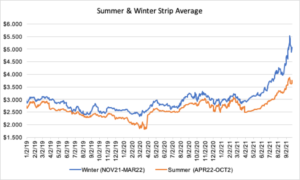
Seasonal Strips
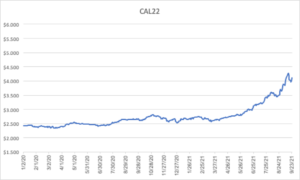
Calendar Year 2022
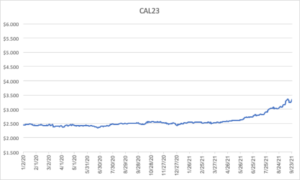
Calendar Year 2023
If prices have you uneasy, give us a call. We can help you manage risk and navigate the current price volatility.
We can help you evaluate your current contract and explore your natural gas buying options. Call us at 866-646-7322 for a no-cost, no-obligation analysis today.