For natural gas report week July 15, 2021, the EIA reported a net increase in storage of 55 Bcf. The injection was at the high end of forecasts which ranged from 39 Bcf to 55 Bcf and averaged 49 Bcf. In comparison, last year for the same week there was an injection of 47 Bcf and the five-year average is an injection of 54 Bcf.
Working gas in storage was 2,629 Bcf as of Friday, July 9, 2021 per EIA estimates. Inventory was 543 Bcf (-17.1%) less than last year for the same week and 189 Bcf (-6.7%) below the five-year average of 2,818 Bcf.
Natural Gas Market Recap
August NYMEX
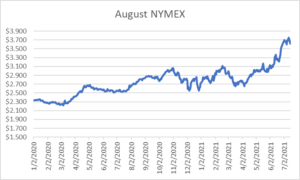
Settled Thursday at $3.614/Dth, down 4.6 cents from Wednesday’s close at $3.660/Dth.
12 Month Strip
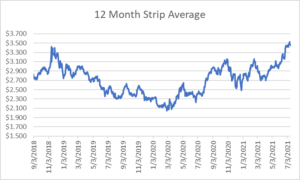
Settled Thursday at $3.451/Dth, down 2.1 cents from the prior week.
Seasonal Strips
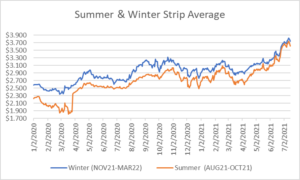
The summer strip (AUG21-OCT21) settled Thursday at $3.608/Dth, down 6.6 cents from the week prior. The winter strip (NOV21-MAR22) settled Thursday at $3.735/Dth, down 1.7 cents from the week prior.
Natural Gas Report – July 15, 2021
Fundamentals
Overall supply averaged 98.1 Bcf/d last week as production grew by 1.0%, week over week. Meanwhile, imports from Canada grew by 2.7%.
Total demand rose by 2.1% from the prior report week, averaging 89.3 Bcf/d. Residential-commercial demand fell by 2.2%. Use in power generation increased 3.4%. Meanwhile, LNG pipeline receipts averaged 10.8 Bcf/d, remaining steady week over week.
Up to this point in injection season, the average rate of injections is 16% lower than the five-year average. If the rate of injections matched the five-year average of 7.9 Bcf/d, inventory would be 3,530 Bcf at the close of refill season. That’s 189 Bcf lower than the five-year average of 3,719 Bcf.
Natural Gas Prices
The market is, if anything, fickle. On the first sizable injection in weeks, NYMEX prices started to deflate. The normalizing of temperatures through much of the country (except the west coast) allowed production to catch up with demand – at least somewhat.
It’s interesting that even though this week’s injection exceeded both last year and the five-year average injections, this single injection did little to move end-of-season storage projections. So why the bearish shift? Since EIA end-of-season storage totals are based on the current rate of injections into storage, if that pace accelerates, the picture changes. To this end, milder temperature forecasts for population-dense regions suggest subdued demand through the end of July. That means storage injections, at least for the next two weeks, are likely to improve end-of-season storage projections. Ultimately this will continue to contribute to bearish sentiment.
DEC21, settled at $3.791/Dth, down 2.5 cents
JAN22, settled at $3.861/Dth, down 1.4 cents
FEB22, settled at $3.786/Dth, down less than a penny
MAR22, settled at $3.557/Dth up less than a penny
APR22, settled at $3.019/Dth up less than a penny
Strips
24 Month, settled at $3.195/Dth down less than a penny
36 Month, settled at $3.040/Dth up less than a penny
Global Natural Gas Markets
Global natural gas prices have rallied, in some cases trading at their highest point in over a decade. Higher prices abroad with comparatively lower Henry Hub spot prices have led to increased demand for U.S. exports. This has created a sustained demand factor that shows little sign of slowing. What’s behind the shift?
Demand
With storage at historic lows in Europe, China focused on avoiding a second year of winter supply shortages, post-pandemic demand restoration, and an array of production issues, U.S. LNG export activity has continued to grow.
High Global Natural Gas Prices
The global shortfalls have led to record prices in many places. Even though Henry Hub prices have continued to climb, U.S. exports still represent an attractive option.
Mexico
Apart from LNG demand, Mexico remains part of the export equation. Here, temperatures (typically warm this time of year) have led to increased use for power generation. This, coupled with growing industrial consumption has created a stable demand source for U.S. export. Domestic ability to meet the rising need was facilitated by the completion of pipeline projects which resulted in added capacity. That’s allowed Mexico to shift from reliance on domestic production and LNG imports to U.S. pipeline imports which, as of June 2021, accounted for 76% of Mexico’s total natural gas supply. Overall, this represents a 25% increase over last year and a 44% increase over the five-year average.
Do you have the best natural gas contract for your business?
We can help you evaluate your current contract and explore your natural gas buying options. Call us at 866-646-7322 for a no-cost, no-obligation analysis today.