
Natural Gas – Week In Review
Natural gas report week, April 7, 2022. It was an interesting week as far as natural gas goes. Production was up and demand was down over last week. Remember, it was just last week that fundamentals aligned to produce the first injection of the year. This week similar fundamentals yielded a 33 Bcf draw from storage and the highest prices since winter 2008.
Why?
The simple explanation is that despite a favorable supply-demand balance for the last couple of weeks, overall storage is still about 20% below last year at this time and 17% short of the five-year average. Nonetheless, current storage totals remain within the five-year range, so attributing the week’s price spikes to a storage deficiency is an oversimplification that warrants additional analysis.
Let’s take a look.
Price Factors: Natural Gas Report Week April 7, 2022
This week’s 33 Bcf withdrawal was in line with analysts’ expectations which ranged from 20 Bcf to 44 Bcf, certainly nothing that would explain this week’s natural gas market.
And in the same way winter transitions to spring such that one day you realize the weather is pleasant all of a sudden, so goes heating-related demand. Warmer temperatures across the report week brought a 6.5 Bcf/d drop in res-com demand. And as fast as winter transitions to spring, shoulder season’s mild temperatures turn hot, trading res-com (heating) demand for power generation (cooling). But this week, power generation related demand declined too, shedding 0.4 Bcf/d.
Even so, prices climbed across the board. Why, if not for supply and demand fundamentals?
The best explanations this week:
Coal supply shortfalls and extremely high coal prices. Explanation in this MarketWatch article.
European supply concerns. Explanation from oilprice.com.
Natural Gas Market Report – April 7, 2022
May NYMEX
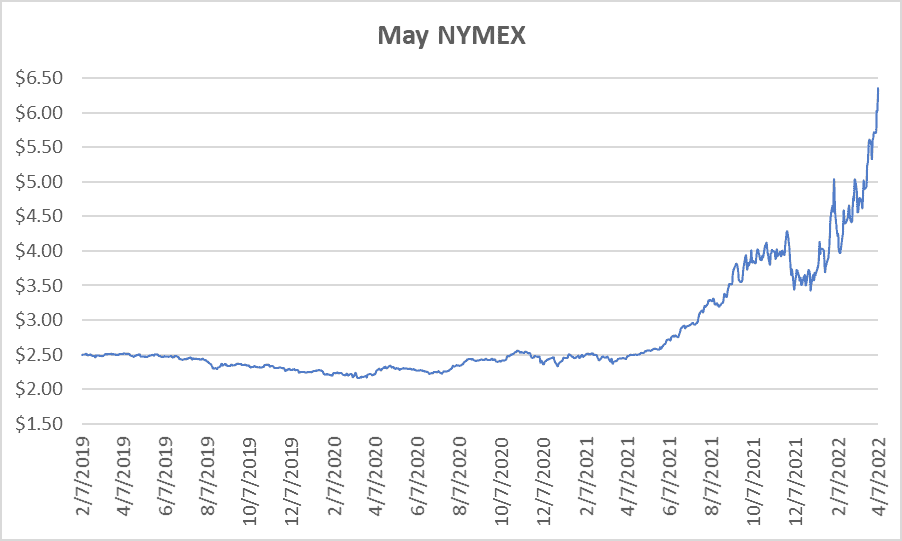
May settled Thursday at $6.359/Dth, up 33.0 cents from Wednesday’s close at $6.029/Dth, and up 71.7 cents over the prior week.
12 Month Strip
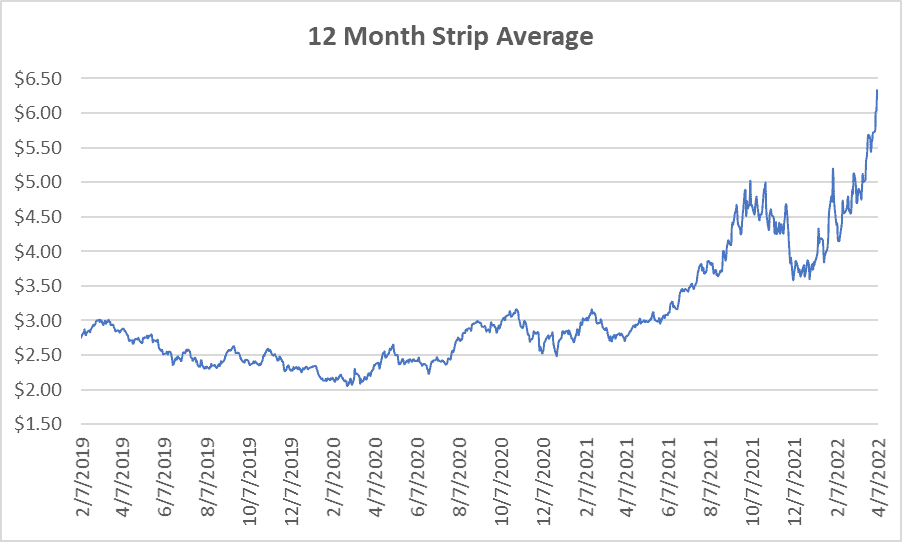
Settled Thursday at $6.327/Dth, up 72.0 cents from the prior week.
Seasonal Strips
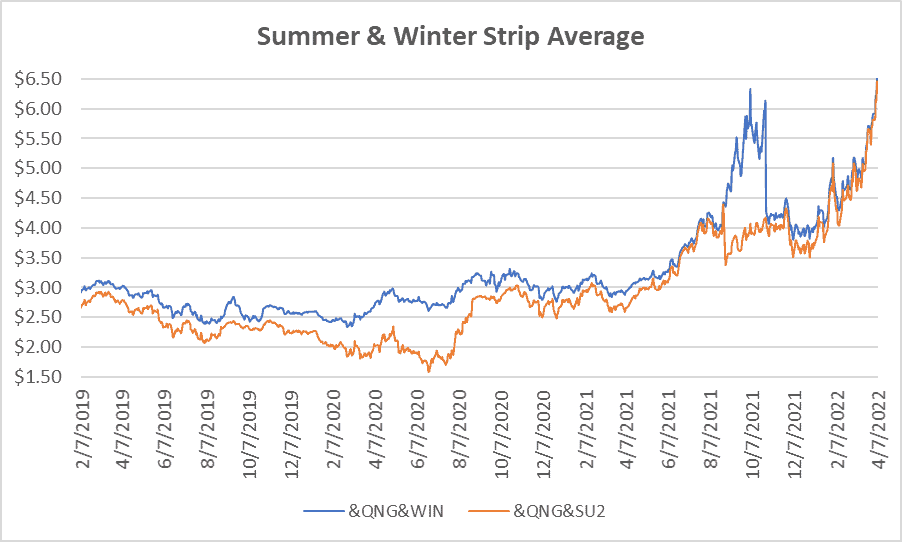
The summer strip (MAY22-OCT22) settled at $6.462/Dth, up 74.1 cents from the week prior.
The winter forward (NOV22-MAR23) settled Thursday at $6.532/Dth, up 74.7 cents from the week prior.
Calendar Years 2022/2023/2024
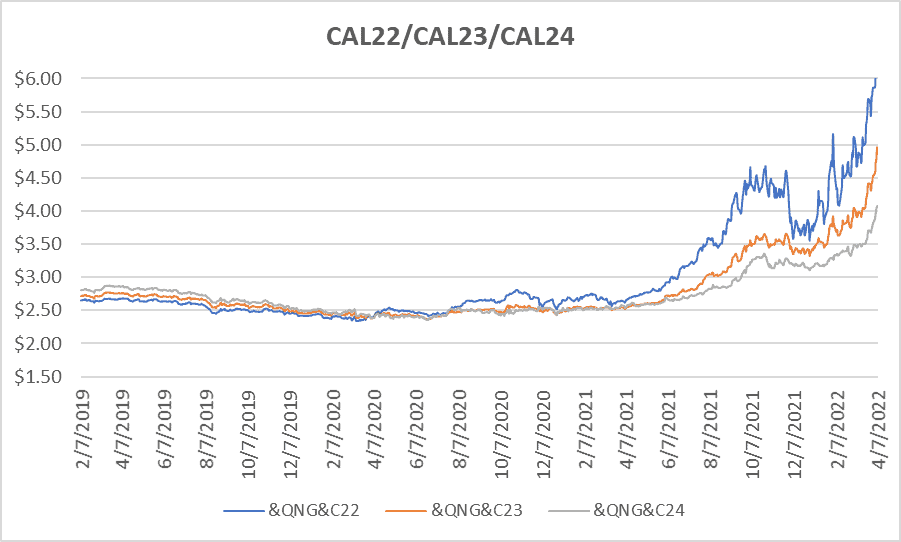
CY22 settled Thursday at $6.508/Dth, up 74.7 cents from the prior week.
CY23 settled Thursday at $4.968/Dth, up 51.6 cents from the prior week.
CY24 settled Thursday at $4.076/Dth, up 31.0 cents from the prior week.
Crude Oil
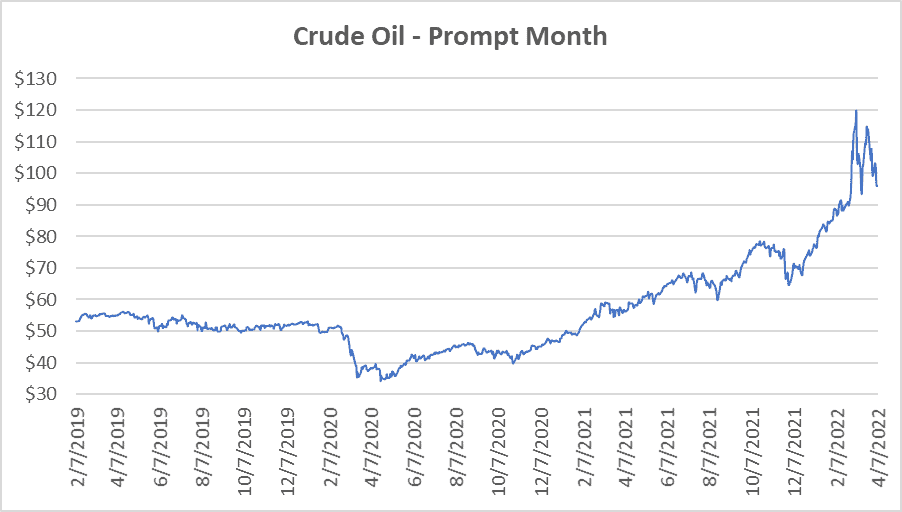
Settled Thursday at $96.03/barrel, down $4.25 from the prior week.
Need Help Making Sense of Natural Gas Prices?
Give us a call. We can help you manage risk and navigate the current price volatility.
We’ll evaluate your current contract and explore your natural gas buying options.
Call us at 866-646-7322 for a no-cost, no-obligation analysis today.