Natural Gas Storage Summary
For natural gas report week, January 16, 2020, the EIA reported a net decrease in natural gas storage of 109 Bcf, exceeding projections ranging from a withdrawal of 87 Bcf to a draw of 106 Bcf. Last year for the same week there was a withdrawal of 82 Bcf and the five-year average is a withdrawal of 184 Bcf.
Working gas in storage was 3,039 Bcf as of Friday, January 10th, 2020 per EIA estimates. Inventory was reported at 494 Bcf (19.4%) higher than last year for the same week and 149 Bcf (5.2%) more than the five-year average of 2,890 Bcf.
Natural Gas Market Recap
February NYMEX
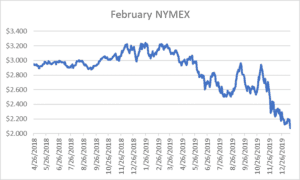
Settled Thursday at $2.077/Dth down 4.3 cents from Wednesday’s close at $2.120/Dth.
12 Month Strip
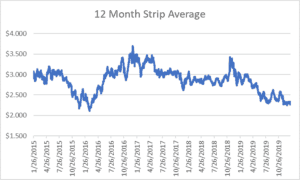
Settled Thursday at $2.269/Dth, down 6.0 cents from last Thursday.
Seasonal Strips
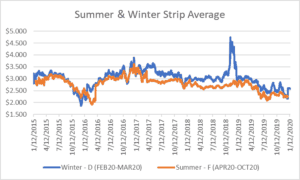
The winter strip (FEB20-MAR20) settled Thursday at $2.571/Dth, down 2.5 cents from last Thursday.
The summer strip (APR20-OCT20) settled Thursday at $2.207/Dth, down 6.2 cents from the prior week.
Natural Gas Weekly
Natural Gas Report – January 16, 2020
Fundamentals
Overall natural gas demand dropped by 3% from last week with residential/commercial, power generation, and industrial declining 4%, 3%, and 1%, respectively. Exports to Mexico increased 5% while LNG exports declined slightly from last week. Total supply fell by 1% as production generally remained consistent and imports from Canada decreased by 25% on lower Midwest and Northeast demand.
Comparatively, residential/commercial is down 6.9 Bcf/d thus far into January 2020 compared to January last year. Production has averaged 92.1 Bcf/d for January 2020, up 4.3 Bcf/d from January 2019.
So far this withdrawal season, the average rate of withdrawal is 15% less than the five-year average. If the rate of withdrawal from storage matched the five-year average of 14.7 Bcf/d from now until March 31, storage inventory would be 1,846 Bcf on March 31 which is 149 Bcf higher than the five-year average of 1,697 Bcf.
Prices
Despite a larger-than-expected storage draw posted Thursday, natural gas prices looked past short-term wintry weather to longer-term, above-average temperatures forecast through the end of January. Hours after the EIA posted their weekly storage numbers, NYMEX prompt month trading started to challenge the $2 mark. The Henry Hub spot price fell to $1.98/Dth Wednesday, the lowest spot price since April 2016 and the lowest spot price for Henry Hub in January trading since 1999. Elsewhere, spot prices remained a reflection of temperatures. Above-average temperatures put downward pressure on prices and areas of cold and snow generally brought increases, albeit temporary, in spot prices.
A Look Ahead
The EIA’s most recent Short Term Energy Outlook provided two-year forecasts including expectations that natural gas production will average 94.7 Bcf/d through 2020 before leveling off at 94.1 Bcf/d in 2021. The EIA anticipates exports (both pipeline and LNG) will average 7.3 Bcf/d in 2020 and 8.9 Bcf/d in 2021, a 3.6 Bcf/d increase from 2019.
Power generation related demand is expected to remain steady, 37% in 2019, 38% in 2020, and 37% in 2021. The contribution from renewables is projected to grow from 17% in 2019 to 22% in 2021. Conversely, coal’s share of electricity generation is expected to fall from 24% in 2019 to 21% in 2021. Nuclear generation is forecasted to drop slightly to less than 20% by 2021, the result of reactor retirements.