Natural Gas Price Analysis
Natural gas report week, November 4, 2021 saw prices retreat amid increased supply which sufficiently balanced demand. Despite chilly weather, the 0.5 Bcf/d increase in production helped push injection season out by another week, delivering an injection of 63 Bcf. In comparison, last year’s report posted a withdrawal of 27 Bcf.
With average to above-average temperatures forecast for the next two weeks and production showing renewed strength, the short-term outlook appears bearish. Let’s take a closer look…
Looking Good
Throughout the second half of 2020, natural gas oversupply and the resulting low-price environment led to investor calls for curtailed production. At the time, the EIA projected production would pick back up once prices restored profitability. In the ensuing months, COVID restrictions contributed to demand depression which did little to help prices and perpetuated production ambivalence. Throughout summer, storage totals lagged behind the five-year average – until the last few weeks when moderate weather conditions and increasing production all but erased that deficit.
Now, as we eek past the calendar close of injection season (by the date, October 31st) and with more moderate temperatures on the horizon, if production keeps pace, we may have additional weeks of injections on the horizon. (It seems likely.) It’s reasonable to expect this to subdue the wild price movement of recent weeks. Of course, as quick as winter forecasts can change, so too can prices, so expect any enduring winter cold – moderate or extreme – to prove bullish for prices.
Weather aside, the future of natural gas as a clean energy or not clean energy and how it fits into sustainability plans will certainly shape demand. In the coming weeks we’ll take a look at current perspectives and what it could mean for prices.
JAN22, settled at $5.826/Dth, down 4.5 cents
FEB22, settled at $5.692/Dth, down 6.8 cents
MAR22, settled at $5.349/Dth down 6.9 cents
APR22, settled at $4.137/Dth down 1.2 cents
MAY22, settled at $4.014/Dth down 2.3 cents
JUN22, settled at $4.038/Dth down 3.0 cents
Natural Gas Market Report – November 4, 2021
December NYMEX
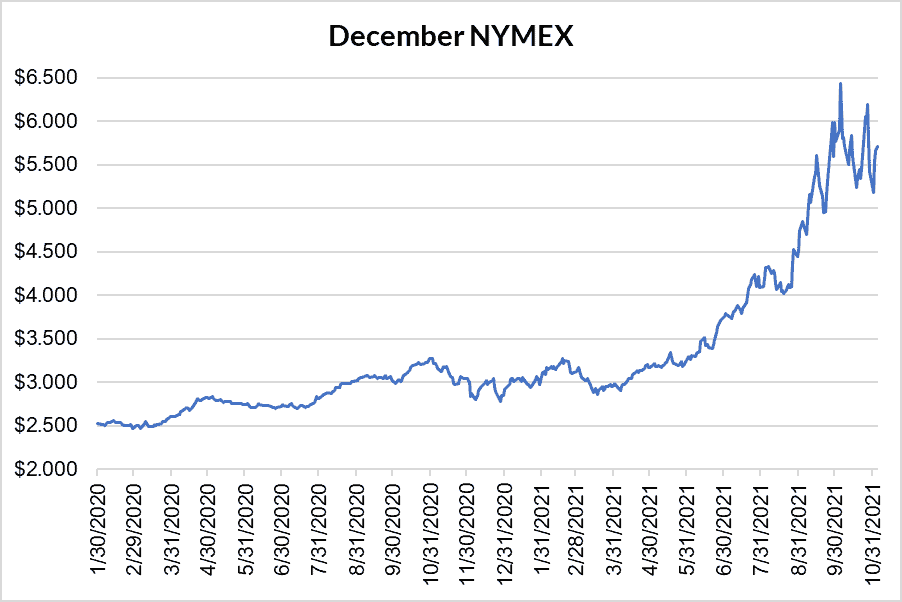
December settled Thursday at $5.716/Dth up 4.6 cents from Wednesday’s close at $5.670/Dth, but down 6.6 cents week over week.
12 Month Strip
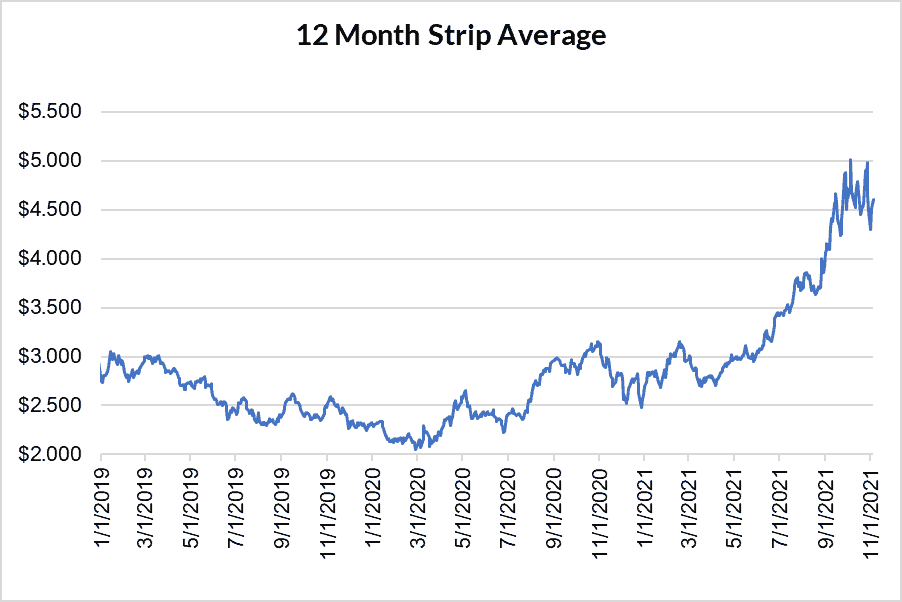
Settled Thursday at $4.605/Dth, down 3.8 cents from the prior week.
Seasonal Strips
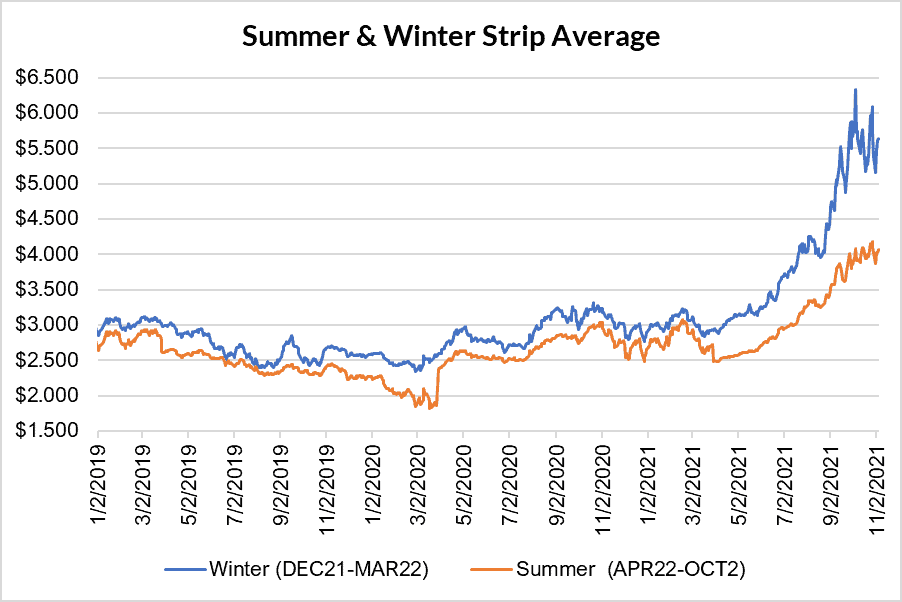
The winter strip (DEC21-MAR22) settled Thursday at $5.646/Dth, down 6.2 cents from the week prior. The summer strip (APR22-OCT22) settled Thursday at $4.072/Dth, down 2.5 cents from the week prior.
Calendar Years 2022/2023/2024
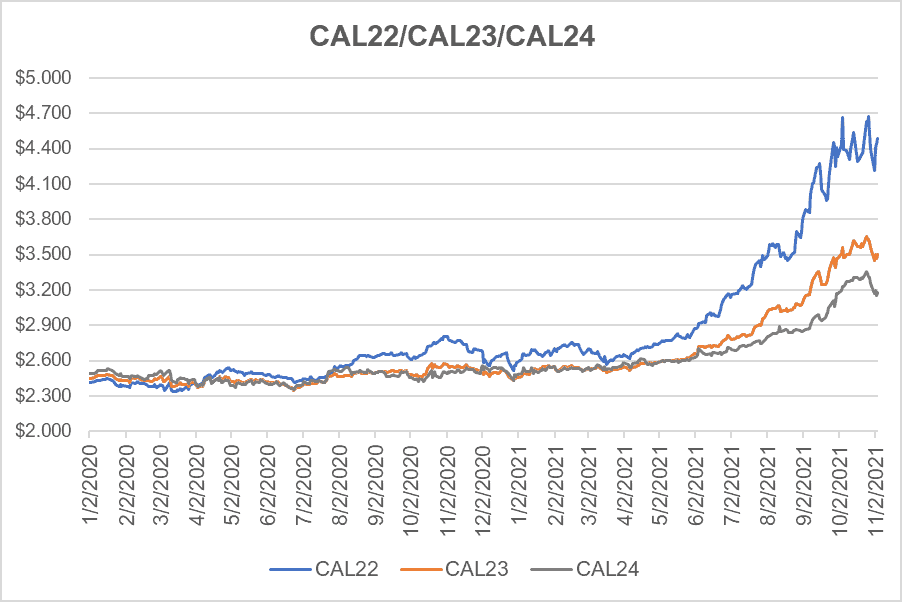
CY22 settled Thursday at $4.490/Dth, down 3.5 cents from the prior week.
CY23 settled Thursday at $3.498/Dth, down 10.9 cents from the prior week.
CY24 settled Thursday at $3.174/Dth, down 13.3 cents from the prior week.
