
Natural Gas Storage Summary
For natural gas report week November 19, 2020, the EIA reported a net increase in storage of 31 Bcf. The build was in line with forecasts ranging from a withdrawal of 19 Bcf to an injection of 41 Bcf, averaging an injection of 21 Bcf. Last year for the same week there was a withdrawal of 66 Bcf and the five-year average is a draw of 24 Bcf.
Working gas in storage was 3,958 Bcf as of Friday, November 13, 2020 per EIA estimates. Inventory was 293 Bcf (8.0%) higher than last year for the same week and 231 Bcf (6.2%) more than the five-year average of 3,727 Bcf.
Natural Gas Market Recap
December NYMEX
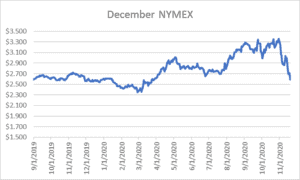
Settled Thursday at $2.592/Dth, down 12.0 cents from Wednesday’s close at $2.712/Dth.
12 Month Strip
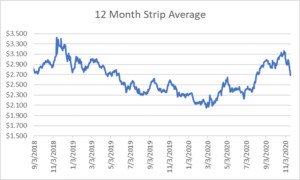
Settled Thursday at $2.689/Dth, down 26.7 cents from the prior week.
Seasonal Strips
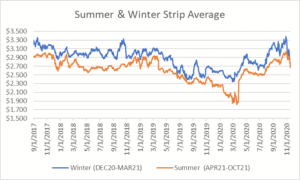
The winter strip (DEC20-MAR21) settled Thursday at $2.669/Dth, down 35.5 cents from the week prior. Looking forward to next summer (APR21-OCT21), the strip settled Thursday at $2.679/Dth, down 22.7 cents from the week prior.
Natural Gas Weekly
Natural Gas Report – November 19, 2020
Natural Gas Fundamentals
Overall supply averaged 95.8 Bcf/d last week as production increased by 2.5%. Meanwhile, imports from Canada increased by 47.8%.
Total demand grew by 22.8% from the prior report week, averaging 98.3 Bcf/d. Residential-commercial demand spiked by a considerable 81.9% upon increased consumption for heating. Consumption for power generation increased by 2.6% Industrial demand grew by 5.98% while exports to Mexico rose by 1.1%.
LNG pipeline receipts are down by 0.6 Bcf/d from last week, averaging 10.2 Bcf/d. Eighteen LNG vessels with a combined carrying capacity of 64 Bcf departed the U.S. between November 12 and November 18, 2020.
The number of rigs in operation increased by 19, up to 388 according to data from Enverus. Baker Hughes rig data shows natural gas specific rigs increased by two from last week, up to 73.
Natural Gas Prices
With substantial downward price movement across the last week and a decent November storage injection posted this week, eyes have turned to weather for a sign of where prices may go. Despite predictions for a 50% increase in Heating Degree Days (HDDs) week-over-week, the overall number of HDDs is still expected to remain below normal for this time of year. As November is expected to close with above-average temperatures for much of the U.S., will December bring more of the same? NOAA’s forecasts for December through February seem to suggest as much.
I’ll leave NOAA’s 90-Day Temperature Forecast here:
If extended above-average temperatures during withdrawal season are an indicator of where prices may go, a bearish setup may take shape.
2020 Natural Gas Injection Season Wrap-Up
As of October 31, natural gas storage totaled 3,920 Bcf according to the EIA’s Weekly Natural Gas Storage Report.
Injection season began with storage at 2,006 Bcf following a winter typified by below-average heating demand. As a result, smaller net injections were necessary to reach an end-of-refill-season storage surplus. Total injections of 1,914 Bcf were 657 Bcf (26.0%) less than the 2019 refill season and 94 Bcf (6.0%) below the five-year average. Nonetheless, total inventory was 194 Bcf (5%) higher than last year and 201 Bcf (5%) higher than the five-year average. The 2020 total marks the third-highest season-end storage level ever recorded.
Comparing 2020 injection season activity to 2019, this year, production averaged 88.5 Bcf/d compared with 92.4 Bcf/d last year. Overall consumption remained steady year-over-year. Increases in residential and commercial as well as LNG demand offset declines in power generation related consumption.