For natural gas report week May 13, 2021, the EIA reported a net increase in storage of 71 Bcf. The build was at the low end of forecasts ranging from injections of 65 Bcf to 82 Bcf, averaging 76 Bcf. Last year for the same week there was an injection of 104 Bcf and the five-year average is an injection of 82 Bcf.
Working gas in storage was 2,029 Bcf as of Friday, May 7, 2021 per EIA estimates. Inventory was 378 Bcf (-15.7%) less than last year for the same week and 72 Bcf (-3.4%) below the five-year average of 2,101 Bcf.
Natural Gas Market Recap
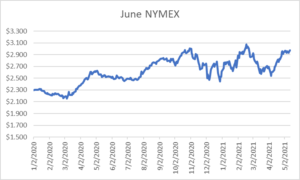
June NYMEX

Settled Thursday at $2.973/Dth, up less than a penny from Wednesday’s close at $2.969/Dth.
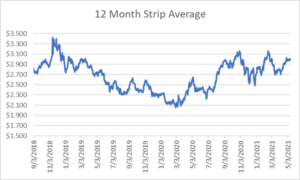
12 Month Strip

Settled Thursday at $3.014/Dth, up 4.1 cents from the prior week.
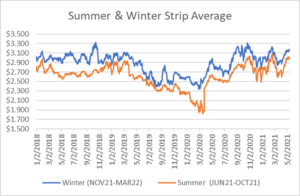
Seasonal Strips

The summer strip (JUN21-OCT21) settled Thursday at $3.021/Dth, up 5.2 cents from the week prior. The winter strip (NOV21-MAR22) settled Thursday at $3.178/Dth, up 4.2 cents from the week prior.
Natural Gas Weekly
Natural Gas Report – May 13, 2021
Natural Gas Fundamentals
Overall supply averaged 96.7 Bcf/d last week as production grew slightly by 0.2%. Even as storage remains at a deficit to both last year and the five-year average, production is 3.6% higher than this time last year. Meanwhile, imports from Canada grew by 6.6%.
Total demand grew by 6.3% from the prior report week, averaging 89.1 Bcf/d. Residential-commercial demand increased by a notable 39.5% on renewed use for heating. Consumption for power generation fell by 5.6%. Industrial demand grew by 2.3% while exports to Mexico rose by 4.7%. LNG pipeline receipts remained nearly unchanged from last week, averaging 11.2 Bcf/d. Twenty-one LNG vessels with a combined carrying capacity of 74 Bcf departed the U.S. between May 6 and May 12, 2021.
Baker Hughes rig data shows the overall number of rigs in operation increased by 8, up to 448. Natural gas specific rigs increased by seven from last week, up to 103. According to the EIA, the total rig count “now stands at 448, the highest level since the last week of April 2020.”
Natural Gas Prices
Throughout the report week, spot prices remained mixed. Below-average temperatures throughout the Midwest and pipeline maintenance in the West drove prices higher while elsewhere temperatures normalized and pipeline constraints eased, resulting in declining prices. NYMEX prices, particularly the 12-month and summer/winter strips found support, perhaps from the current storage track, which remains below the five-year average pace. As such, focus on end-of-injection season storage totals seems to be driving market response as concern for winter begins to loom. Should injections pick up and storage begin to close the gap on that deficit, it’s likely to subdue prices (absent other supply/demand change impacts).
Power Generation Related Demand To Decline This Summer
Higher natural gas prices for power generators is expected to mean less natural gas and more coal used in power generation during the upcoming summer. According to the EIA, “The forecast U.S. cost of natural gas delivered to electric generators averages $3.13 per million British thermal units this summer, which would be 46% higher than during summer 2020 and close to the price during summer 2018. Less natural gas-fired generation is partly offset by increased generation from coal-fired power plants, which become more economical to run than in previous years. We forecast that the overall level of U.S. natural gas-fired generation this summer will fall to about the same amount generated in 2018. Although we expect coal generation to rise this summer, the forecast level is still 12% below the 2018 level.” Read the rest of the EIA forecast here.
Do you have the best natural gas contract for your business?
We can help you evaluate your current contract and explore your natural gas buying options. Call us at 866-646-7322 for a no-cost, no-obligation analysis today.
