
Natural Gas – Week In Review
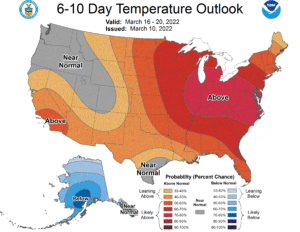
Natural gas report week, March 10, 2022 saw continued volatility in both international and domestic energy markets. Nonetheless, natural gas markets trended down on warm weather forecasts and declining demand. So at a time when we can all use a little bit of good news, it seems the end of withdrawal season will usher in warmer weather and downward pressure on prices.
Natural Gas Market – A Quick Recap
Last week’s draw of 124 Bcf, although higher than both last year’s draw (9 Bcf) and the five-year average (89 Bcf), was in line with analysts’ projections. As overall supply remained the same from week to week, demand dropped by 12.7 Bcf/d to 107.8 Bcf/d. The largest factor in the drop was a 8.4 Bcf/d decline in residential-commercial demand thanks to diminishing heated-related use.
The trend will likely continue should current forecasts hold. At present, throughout the next two weeks, the majority of the country is expected to enjoy above-average temperatures. The impact on heating-related demand should translate to an early start to injection season, with the first injection of the season predicted for natural gas report week ending March 24, 2022.
As it stands, the EIA forecasts end-of-season storage totals will be 1,376 Bcf on March 31, 290 Bcf less than the five-year average of 1,666 Bcf.
Natural Gas Market Report – March 10, 2022
April NYMEX
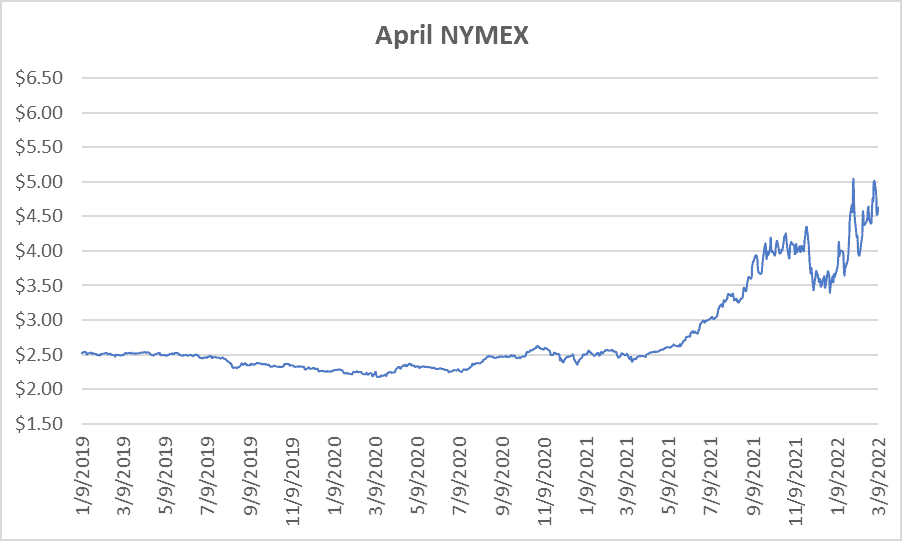
April settled Thursday at $4.6310/Dth, up 10.5 cents from Wednesday’s close at $4.5260/Dth, but down 9.1 cents over the prior week.
12 Month Strip
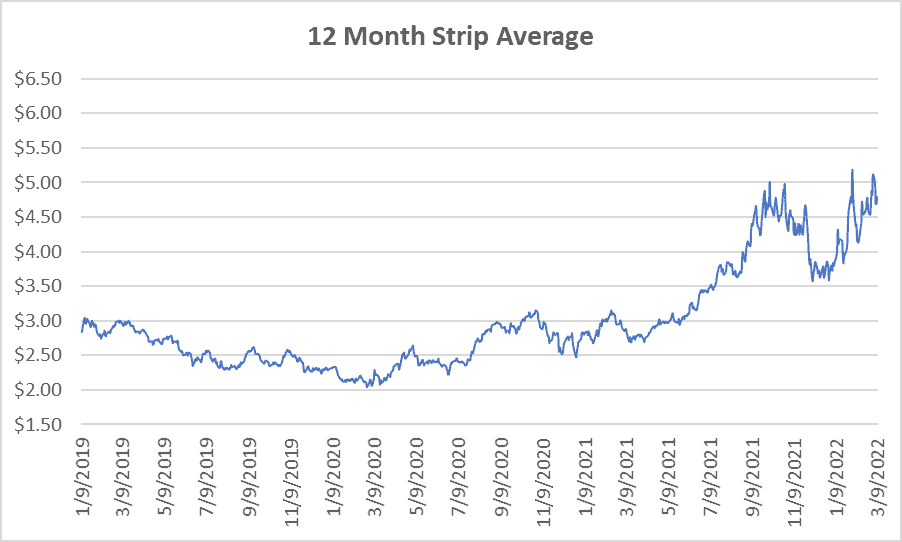
Settled Thursday at $4.799/Dth, down 3.5 cents from the prior week.
Seasonal Strips
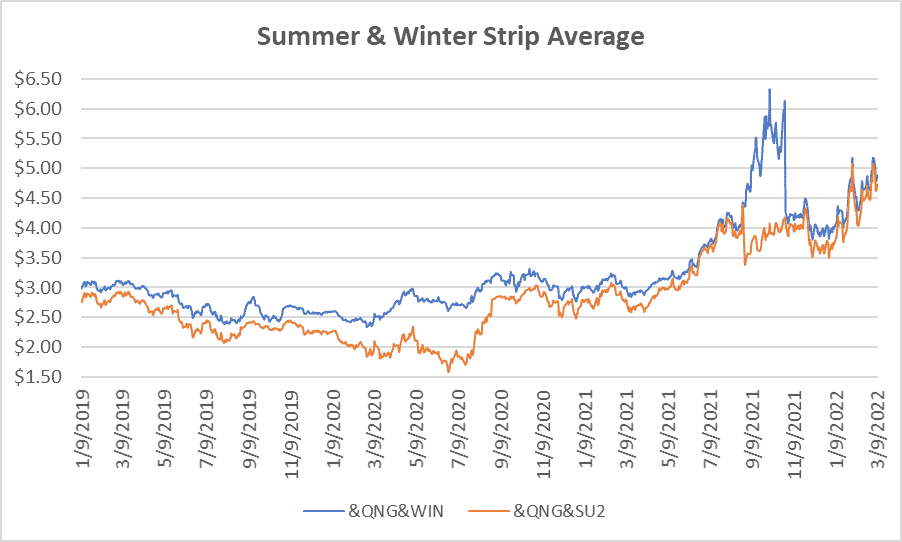
The summer strip (APR22-OCT22) settled at $4.737/Dth, down 4.7 cents from the week prior.
The winter forward (NOV22-MAR23) settled Thursday at $4.886/Dth, down 1.7 cents from the week prior.
Calendar Years 2022/2023/2024
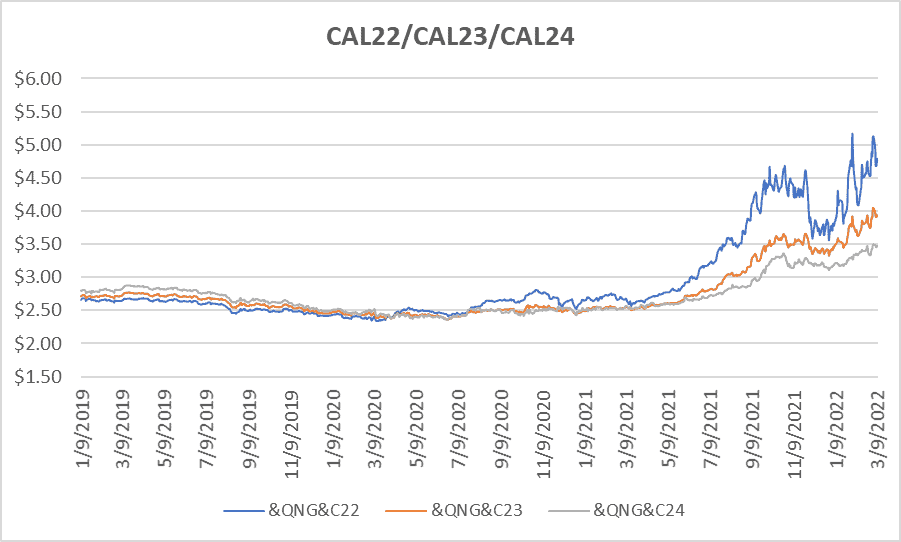
CY22 settled Thursday at $4.783/Dth, down 4.2 cents from the prior week.
CY23 settled Thursday at $3.939/Dth, up 3.9 cents from the prior week.
CY24 settled Thursday at $3.475/Dth, up 4.9 cents from the prior week.
Crude Oil
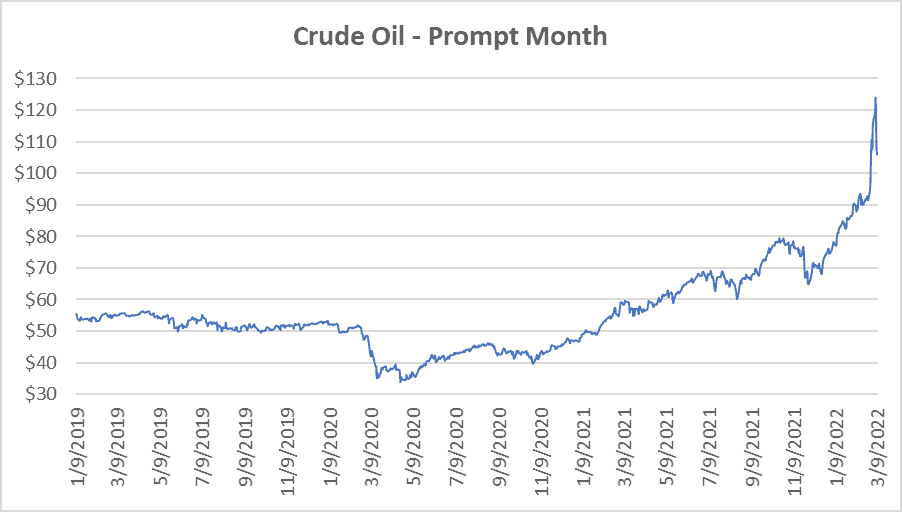
Settled Thursday at $106.02/barrel, down $1.65 from the prior week.
Need Help Making Sense of Natural Gas Prices?
Give us a call. We can help you manage risk and navigate the current price volatility.
We’ll evaluate your current contract and explore your natural gas buying options.
Call us at 866-646-7322 for a no-cost, no-obligation analysis today.