
Natural Gas Storage Summary
For the natural gas report week, January 9, 2020, the EIA reported a net decrease in natural gas storage of 44 Bcf, near the low end of projections ranging from a withdrawal of 40 Bcf to a draw of 62 Bcf. Last year for the same week there was a withdrawal of 81 Bcf and the five-year average is a withdrawal of 156 Bcf.
Working gas in storage was 3,148 Bcf as of Friday, January 3rd, 2020 per EIA estimates. Inventory was reported at 521 Bcf (19.8%) higher than last year for the same week and 74 Bcf (2.4%) more than the five-year average of 3,074 Bcf.
Natural Gas Market Recap
February NYMEX
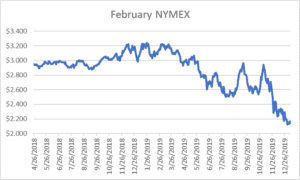
February settled Thursday at $2.166/Dth up 2.5 cents from Wednesday’s close at $2.141/Dth.
12 Month Strip
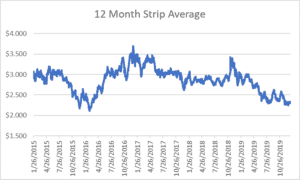
Settled Thursday at $2.329/Dth, up 3.9 cents from last Thursday.
Seasonal Strips
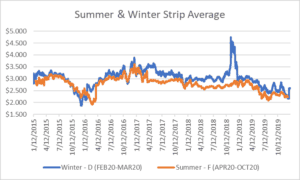
The winter strip (FEB20-MAR20) settled Thursday at $2.596/Dth, up 1.9 cents from last Thursday. The summer strip (APR20-OCT20) settled Thursday at $2.269/Dth, up 4.4 cents from the prior week.
Natural Gas Weekly
Natural Gas Report – January 9, 2020
Fundamentals
Overall consumption grew by 10% (from 84.8 Bcf/d to 93.5 Bcf/d) week-over-week, largely the result of typical winter temperatures. Heating demand led U.S. consumption in weekly growth as residential/commercial increased by 15%, followed by power generation (11%), and industrial (2%). Exports to Mexico increased 16% from the prior week. LNG exports also grew as 19 ships with a combined capacity of 68 Bcf departed the United States. Forecasts for LNG exports anticipate an average 8.25 Bcf/d of through January 2020 which nearly doubles 2018. That rate is expected to drop significantly into the latter half of 2020 as global oversupply slows demand.
Prices
2020 kicked off with Henry Hub spot prices at a three-year low. Overall in 2019, spot prices were among the lowest seen over the last three years, with Henry Hub averaging just $2.57/Dth in 2019 and projections centering around an average of $2.31/Dth in 2020. While analysts anticipate that markets may flirt with $2.00/Dth prices, they are quick to add such lows are not sustainable long-term and that the market will correct itself.
As another sign of a sluggish natural gas market, the rate at which oil trades compared to natural gas, recently reached 30-to-1. The five-year average is 19-to-1 whereas normal should be closer to 6-to-1. Fox business predicts the current oil-to-gas ratio imbalance may become more pronounced as average gas prices fall for a second consecutive year.
Either way, current prices may be a good buy in the event the second half of winter gets colder. Not sure what this means for you? Give us a call, we’re happy to help you evaluate your options.
A Look Back at 2019
Production set new records in 2019, lifted by growth in the Permian, Appalachian, and Haynesville Basins and supported by added pipeline capacity. Even with low prices disincentivizing additional natural-gas directed drilling, especially in the latter half of 2019, substantial growth came from associated gas production which S&P notes accounts for nearly half of U.S. gas production. The lower prices led to increased consumption for power generation which likewise hit new records in 2019, most notably during the summer. Exports also broke records thanks to LNG. The EIA expects that the U.S. will be a net exporter of LNG through 2050.