
Natural Gas – Week In Review
Prices retreated across natural gas report week, January 20, 2022 on moderating forecasts and easing global supply concerns. Despite the EIA’s report of a 206 Bcf withdrawal which was the largest to this point in withdrawal season and also exceeded the five-year average net withdrawals of 167 Bcf and last year’s net withdrawals of 179 Bcf, conditions were insufficient to maintain the price gains from last week.
Natural Gas Outlook
While analysts expect considerable draws to continue for the upcoming weeks, international developments may once again be influencing domestic prices.
This week, Chinese sale of excess LNG cargoes to Europe helped alleviate winter storage concerns. Scheduled deliveries now through November have translated to confidence in supply stability resulting in international prices below $25/MMBtu. While there’s some hesitation the increased supply may flood the market, it’s unlikely to impact contractual scheduled deliveries of US LNG.
Looking to end-of-season projections…the average rate of withdrawal from storage is 15% lower than the five-year average so far this season. If that rate matches the five-year average of 14.6 Bcf/d for the remainder of the season, storage would total 1,699 Bcf, 33 Bcf higher than the five-year average of 1,666 Bcf for March 31.
MAR22, settled at $3.649/Dth down 35.6 cents
APR22, settled at $3.648/Dth down 29.0 cents
MAY22, settled at $3.693/Dth down 26.5 cents
JUN22, settled at $3.748/Dth down 26.3 cents
JUL22, settled at $3.808/Dth down 26.2 cents
AUG22, settled at $3.823/Dth down 25.9 cents
SEP22, settled at $3.807/Dth down 25.6 cents
Natural Gas Market Report – January 20, 2022
February NYMEX
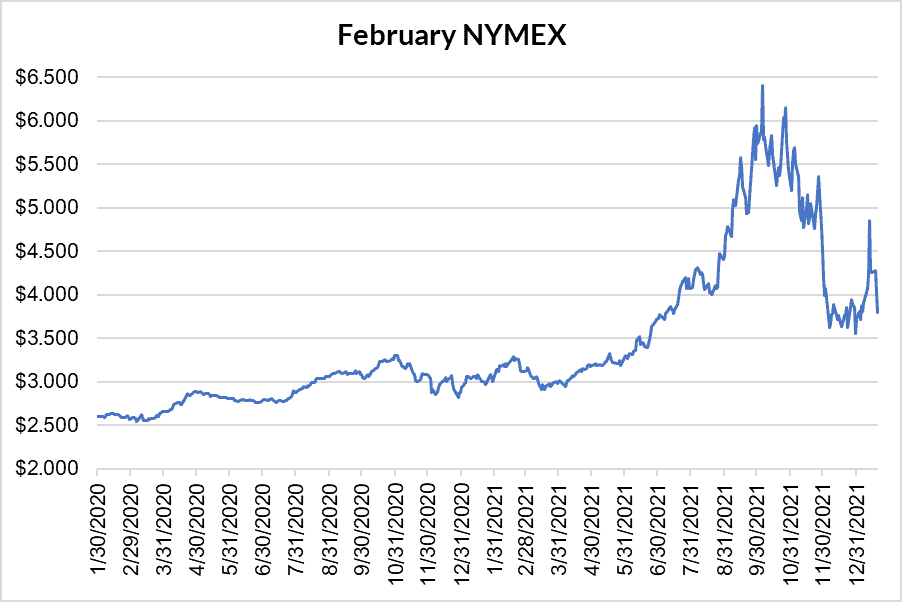
February settled Thursday at $3.802/Dth down 22.9 cents from Wednesday’s close at $4.031/Dth and down 46.8 cents week-over-week.
12 Month Strip
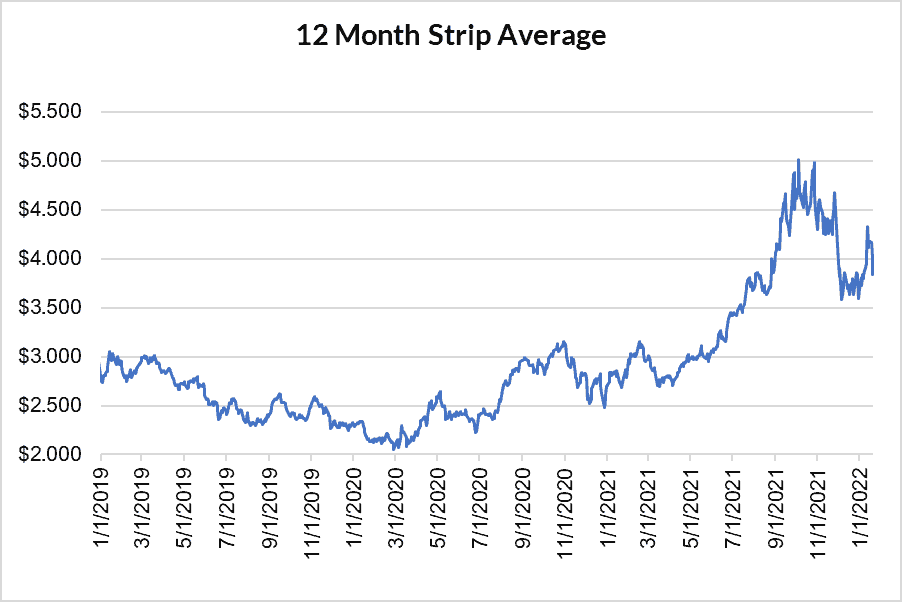
Settled Thursday at $3.839/Dth, down 28.0 cents from the prior week.
Seasonal Strips
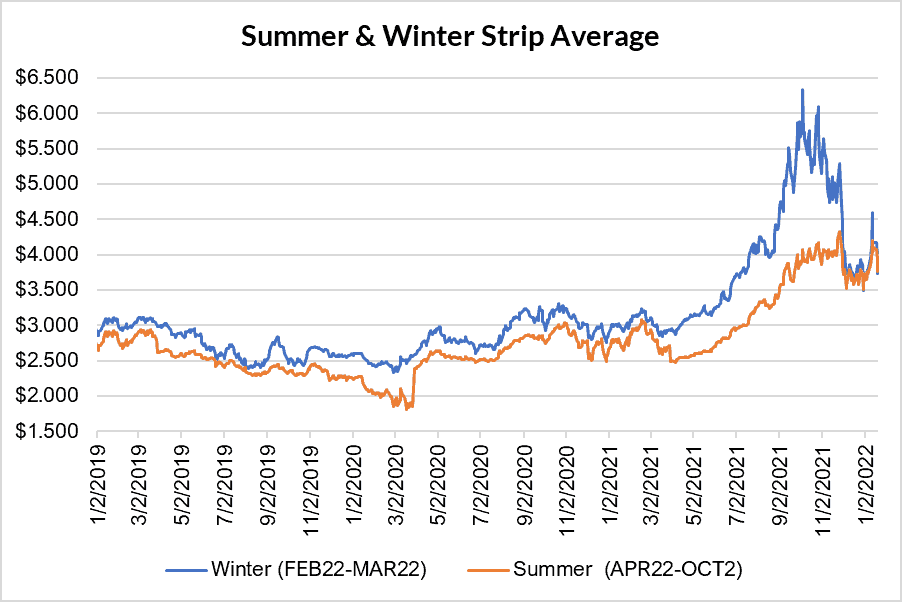
The balance of the winter strip settled Thursday at $3.726/Dth, down 41.2 cents from the week prior. The summer strip (APR22-OCT22) settled at $3.766/Dth, down 26.4 cents from the week prior.
Calendar Years 2022/2023/2024
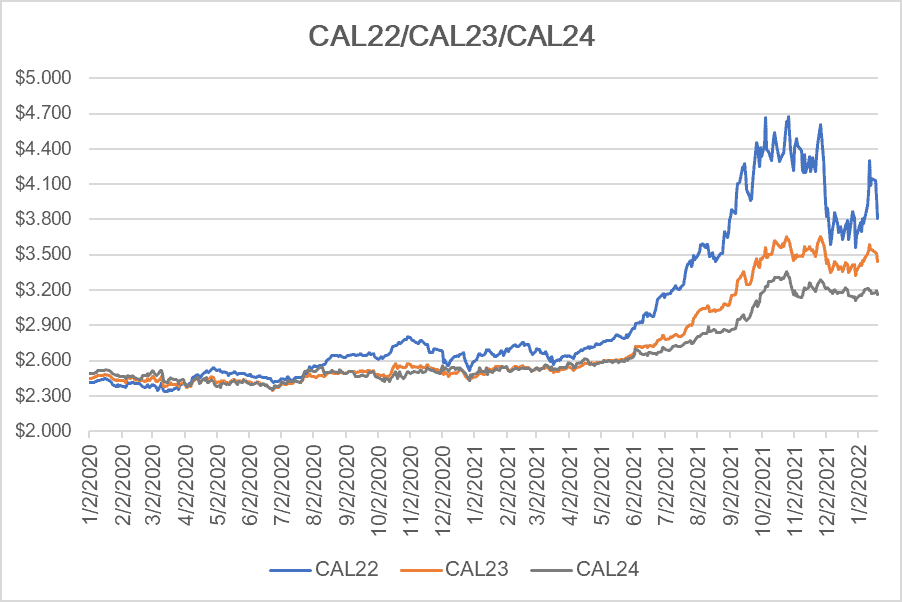
CY22 settled Thursday at $3.805/Dth, down 28.5 cents from the prior week.
CY23 settled Thursday at $3.445/Dth, down 9.9 cents from the prior week.
CY24 settled Thursday at $3.166/Dth, down 2.8 cents from the prior week.
Crude Oil
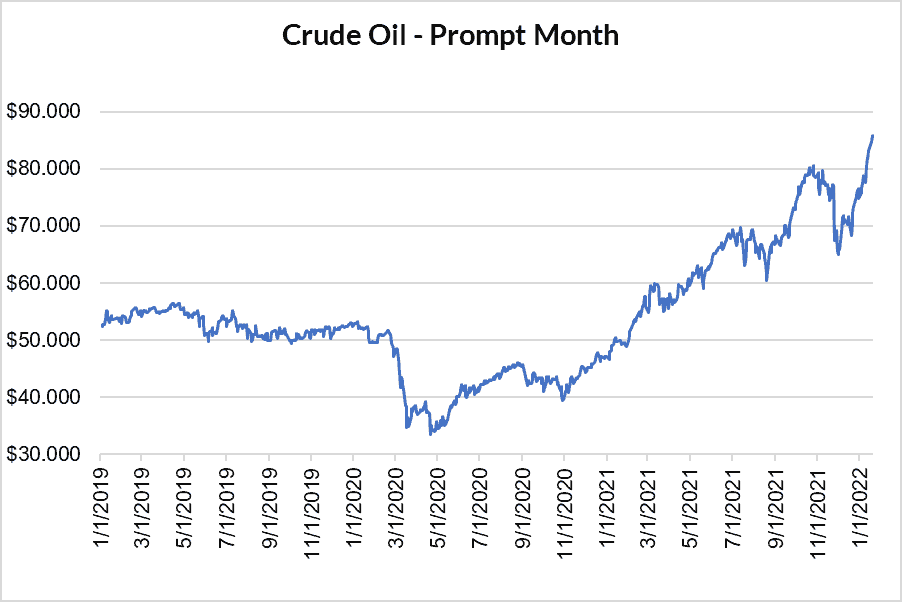
Settled Thursday at $85.55/barrel, up $3.93 from the prior week.
Need Help Making Sense of Natural Gas Prices?
Give us a call. We can help you manage risk and navigate the current price volatility.
We’ll evaluate your current contract and explore your natural gas buying options.
Call us at 866-646-7322 for a no-cost, no-obligation analysis today.