
Natural Gas Storage Summary
For natural gas report week, February 6, 2020, the EIA reported a net decrease in storage of 137 Bcf, just above projections ranging from a withdrawal of 114 Bcf to a draw of 136 Bcf. Last year for the same week there was a withdrawal of 228 Bcf and the five-year average is a withdrawal of 143 Bcf.
Working gas in storage was 2,609 Bcf as of Friday, January 31st, 2020 per EIA estimates. Inventory was reported at 615 Bcf (30.8%) higher than last year for the same week and 199 Bcf (8.3%) more than the five-year average of 2,410 Bcf.
Natural Gas Market Recap
March NYMEX
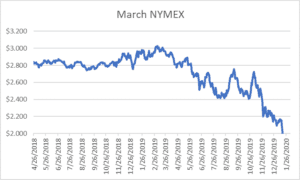
Settled Thursday at $1.862/Dth up less than a penny from Wednesday’s close at $1.861/Dth.
12 Month Strip

Settled Thursday at $2.154/Dth, up less than a penny from last Thursday.
Seasonal Strips
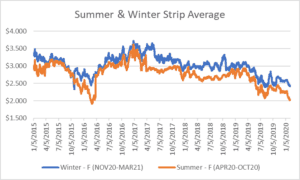
The summer forward strip (APR20-OCT20) settled Thursday at $2.033/Dth, up less than a penny from the prior week. The winter forward strip (NOV20-MAR21) settled Thursday at $2.437/Dth, up less than a penny from last Thursday.
Natural Gas Weekly
Natural Gas Report – February 6, 2020
Important Trends
According to NOAA, “January 2020 was the fifth warmest January on record. All 48 contiguous states saw above- to much-above-average temperatures last month.” This has suppressed heating-related demand. Consumption for power generation has been subdued by contributions from nuclear power. The EIA explained, “Although nuclear power plant outages tend to be relatively low in January, this January’s outages have been at multi-year lows for the month, moderating the demand for natural gas-fired generation so far this winter.”
Despite a 40% cut in gas rigs over last year, January 2020 production totals are the third-highest on record, behind November and December 2019. According to the EIA, production has averaged 95.5 Bcf/d since November. At that rate, by the end of March, it would be 7.0 Bcf/d higher than last winter.
That production remains high despite of declining gas rigs affirms that an increasing portion of natural gas production is associated gas, or gas produced through oil wells. With the coronavirus outbreak, Chinese oil consumption has dropped 20% due to travel restrictions. The drop in demand translates to a drop in profits. With energy companies already combating weak earnings by cutting production and exploration, analysts expect investors to push for additional cuts, thereby decreasing associated natural gas production.
Price Forecast, Why The Trends Matter
As historians are fond of noting, if you want to know where you’re going, you have to know where you’ve been. That’s important because as natural gas prices recently fell below $2.000/Dth for the first time since Spring 2016, it’s a good time to look back at what happened in 2016 after prices fell.
In 1Q 2016, above-average winter temperatures and excess supply led to unseasonable price drops. March futures settled at $1.711 and on March 1st, Henry Hub spot prices fell to $1.570/Dth. Prices gradually increased roughly 70% across late spring due to rising demand and decreasing production. This set the stage for sharp price increases during the 2016-2017 winter when prices spiked more than 130% over the early Spring lows.
Why it matters
In 2016 oversupply and current market conditions led to cuts in production. Current rig counts are near the 2016 levels that preceded the price spikes. Other global factors allude to production cuts. Whereas current production cuts have, at least in part, been driven by investors demanding profitability, higher prices are a requisite for getting there.