
Natural Gas Storage Summary
For natural gas report week, February 20, 2020, the EIA reported a net decrease in storage of 151 Bcf, in line with projections ranging from a withdrawal of 128 Bcf to a draw of 158 Bcf. Last year for the same week there was a withdrawal of 163 Bcf and the five-year average is a withdrawal of 136 Bcf.
Working gas in storage was 2,343 Bcf as of Friday, February 14th, 2020 per EIA estimates. Inventory was reported at 613 Bcf (35.4%) higher than last year for the same week and 200 Bcf (9.3%) more than the five-year average of 2,143 Bcf.
Natural Gas Market Recap
March NYMEX
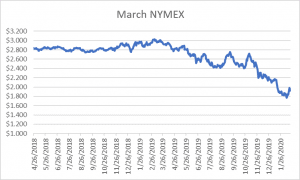
Settled Thursday at $1.920/Dth down 3.5 cents from Wednesday’s close at $1.955/Dth.
12 Month Strip
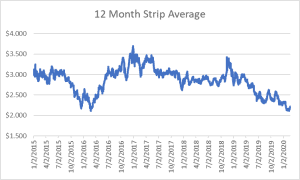
Settled Thursday at $2.182/Dth, up 3.0 cents from last Thursday.
Seasonal Strips
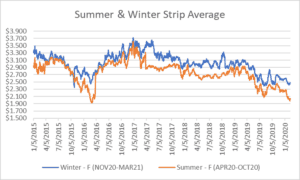
The summer forward strip (APR20-OCT20) settled Thursday at $2.019/Dth, down 1.4 cents from the prior week. The winter forward strip (NOV20-MAR21) settled Thursday at $2.465/Dth, up 2.8 cents from last Thursday.
Natural Gas Weekly
Natural Gas Report – February 20, 2020
Fundamentals
Overall supply averaged 100.4 Bcf/d last week with production remaining steady and average net imports from Canada increasing by 7%. Total demand increased by 5% from the prior report week with residential/commercial consumption up 7%, industrial up by 1% and exports to Mexico up by 3% while power-generation fell by 1%.
Overall prices rose in response to chilly (normal) winter temperatures.
So far this withdrawal season, the average rate of withdrawal is 11% less than the five-year average. If the rate of withdrawal from storage matched the five-year average of 9.7 Bcf/d from now until March 31, storage inventory would be 1,897 Bcf which is 200 Bcf higher than the five-year average of 1,697 Bcf.
Important Trends
Last week we examined global LNG oversupply conditions and the extent to which watching LNG
contracts may serve as an indicator of declining export market opportunities. As of last week, conditions appeared optimistic as the issue hadn’t led to contract cancellations or requested re-negotiations for most exporters. This week, that changed as a Spanish utility was among the first to reportedly retreat from a prior LNG commitment.
The cancellation supports claims made at last week’s 19th annual S&P Global Platts LNG Conference. “LNG producers were encouraged…to shut in some supply amid the global glut that is helping drive down prices in Asia, or push more volumes to markets beyond Europe, perhaps Latin America. The takeaway…was that something has to give, and soon, to allow for more liquefaction projects to be built in time to fill a projected supply shortage around the middle of the decade.”
While Europe represented a promising LNG market, current excess supply means shippers will need to find new takers for LNG exports. Brazil may be one Latin American opportunity, but it’s unlikely they can absorb enough LNG to reverse current oversupply conditions.
Why It Matters
Absent shutting off supply to tighten up the supply-demand imbalance, current conditions will continue to exert downward pressure on prices. With prices so low, developers have struggled to secure enough long-term contracts to finance construction of new terminals previously scheduled to start around the middle of the decade. In the interim, some have delayed investment decisions. As the LNG market rights itself, this could eventually lead to an inability to meet increasing LNG demand as lags in supply infrastructure development hamper suppliers from keeping pace. For now, short-term gains through shut-ins may produce a more stable market later in the 2020s.