
Natural Gas – Week In Review
Prices reversed course and are on the rise once again for natural gas report week, February 17, 2022. There’s a saying commonly heard in Northwest Ohio this time of year: “Don’t like the weather? Wait a minute. It will change.” Indeed, the last week brought everything Mother Nature had to throw from a 50 degree drop in temperatures from one day to the next and buckets of rain to more piles of snow, there was a little something for everyone.
It seems the natural gas market has inherited weather’s diverse tendencies, looking rather bearish one week and downright bullish the next.
Is the correlation as simple as Old Man Winter’s grip on natural gas prices? Let’s take a look…
Natural Gas Market – Fundamentally Driven?
Before we dig too deep, let me remind you that natural gas prices were on the rise across the last week, in some cases the increase was almost half a dollar. You’d expect something to be amiss with the fundamentals, right? But that’s not exactly what happened.
Supply
Overall numbers were up with the most noteworthy gains we’ve seen in quite a while. Production grew 5.1% (4.6 Bcf/d) week-over-week and is up 11.5 Bcf/d over last year. This contributed to an impressive supply report, showing we’re up 3.1/Bcf/d over last week and 10.0 Bcf/d over last year.
Before we get pessimistic over EIA end-of-season storage forecasts which has us at 1,415 Bcf (251 Bcf lower than the five-year average of 1,666 Bcf), it’s worth emphasizing should production remain steady, we’re in decent shape to start spring.
Demand
So if production is solid and prices are running, surely that means demand must be up, yes? Nope. Not that either. Overall demand dropped substantially too. Shedding 8.7 Bcf/d of residential demand due to warmer weather in places that aren’t Northwest Ohio, overall demand totaled 117.1 Bcf which is 11.3 Bcf/d less than last week and 18.7 Bcf/d under the year before.
What Gives?
While deteriorating Russian-Ukrainian relations may be aggravating factors, the larger culprit, at least for the short-term, can aptly be summarized in one image:
NOAA 6-10 Day Temperature Outlook
While that forecast softens some in the 8-10 day outlook, it seems March may come in like a lion, dragging natural gas prices with it.
Natural Gas Market Report – February 17, 2022
March NYMEX
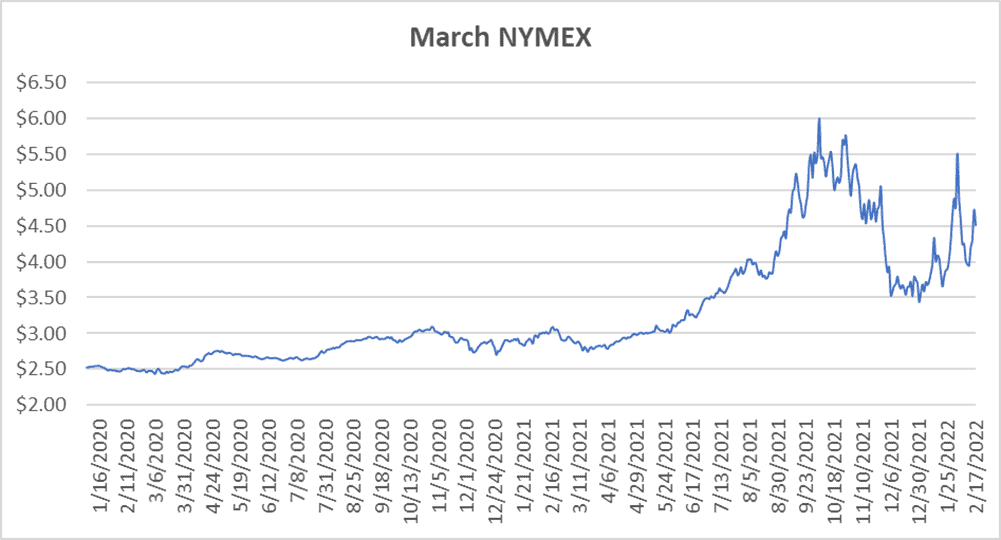
March settled Thursday at $4.486/Dth, down 23.1 cents from Wednesday’s close at $4.717/Dth but up 52.7 cents week-over-week.
12 Month Strip
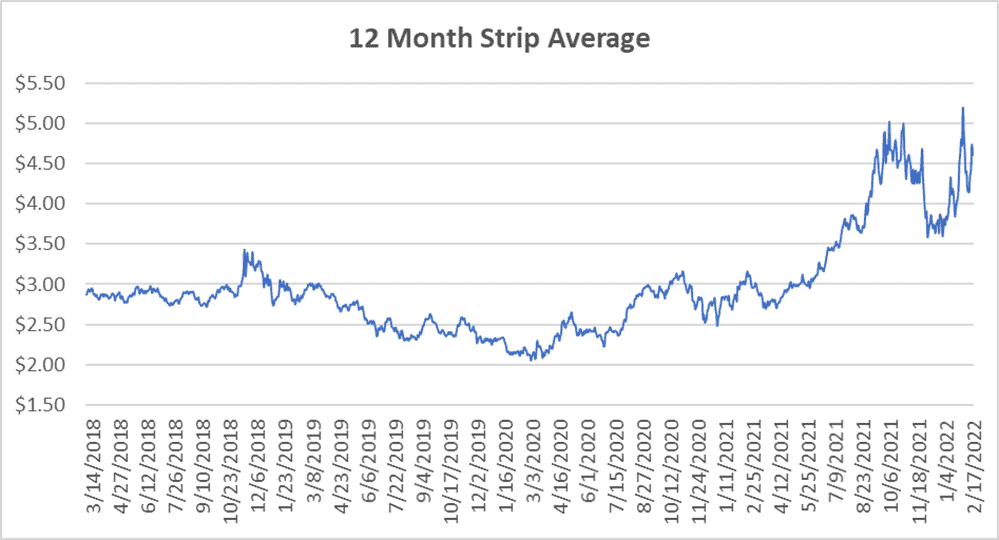
Settled Thursday at $4.599/Dth, up 45.4 cents from the prior week.
Seasonal Strips
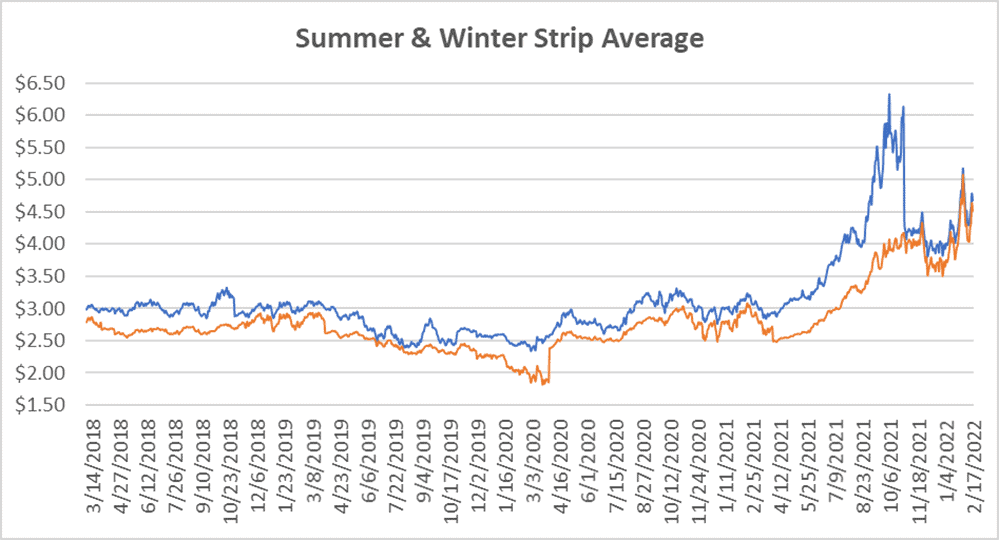
The summer strip (APR22-OCT22) settled at $4.515/Dth, up 46.9 cents from the week prior.
The winter forward (NOV22-MAR23) settled Thursday at $4.681/Dth, up 38.4 cents from the week prior.
Calendar Years 2022/2023/2024
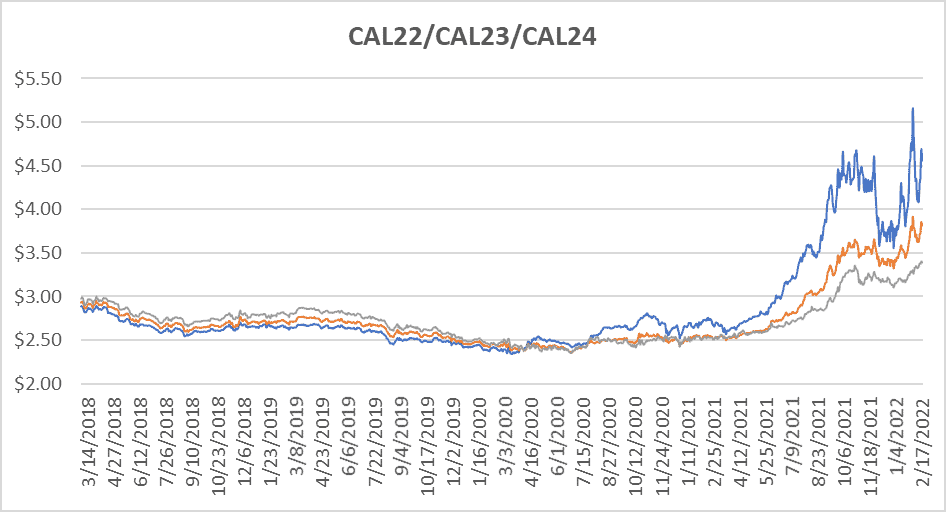
CY22 settled Thursday at $4.555/Dth, up 46.7 cents from the prior week.
CY23 settled Thursday at $3.822/Dth, up 19.2 cents from the prior week.
CY24 settled Thursday at $3.393/Dth, up 5.8 cents from the prior week.
Crude Oil
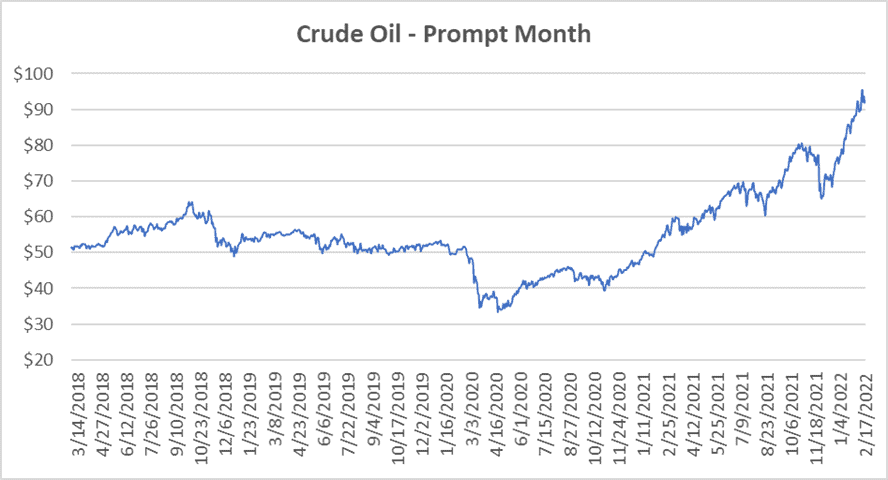
Settled Thursday at $91.76/barrel, up $1.88 from the prior week.
Need Help Making Sense of Natural Gas Prices?
Give us a call. We can help you manage risk and navigate the current price volatility.
We’ll evaluate your current contract and explore your natural gas buying options.
Call us at 866-646-7322 for a no-cost, no-obligation analysis today.