
Natural Gas Storage Summary
For natural gas report week, February 13, 2020, the EIA reported a net decrease in storage of 115 Bcf, in line with projections ranging from a withdrawal of 102 Bcf to a draw of 116 Bcf. Last year for the same week there was a withdrawal of 101 Bcf and the five-year average is a withdrawal of 131 Bcf.
Working gas in storage was 2,494 Bcf as of Friday, February 7th, 2020 per EIA estimates. Inventory was reported at 601 Bcf (31.7%) higher than last year for the same week and 215 Bcf (9.4%) more than the five-year average of 2,279 Bcf.
Natural Gas Market Recap
March NYMEX
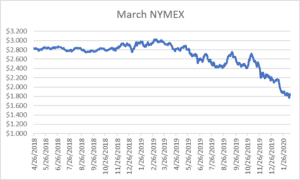
Settled Thursday at $1.826/Dth down 1.8 cents from Wednesday’s close at $1.844/Dth.
12 Month Strip
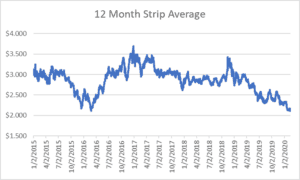
Settled Thursday at $2.152/Dth, down less than a penny from last Thursday.
Seasonal Strips
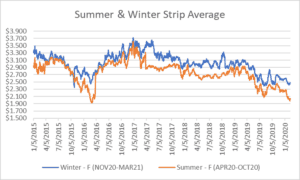
The summer forward strip (APR20-OCT20) settled Thursday at $2.019/Dth, down 1.4 cents from the prior week. The winter forward strip (NOV20-MAR21) settled Thursday at $2.465/Dth, up 2.8 cents from last Thursday.
Natural Gas Weekly
Natural Gas Report – February 13, 2020
Fundamentals
Overall supply averaged 99.8 Bcf/d last week with production remaining steady and average net imports from Canada increasing by 2%. Despite week-over-week numbers showing production has been consistently flat, it’s up 5.1 Bcf/day over last year has and averaged 92.0 Bcf/d so far this month.
Total demand increased by 5% from the prior report week with residential/commercial consumption up 7%, industrial up by 2%, and power-generation up by 4% while exports to Mexico declined by 3%. So far this withdrawal season, the average rate of withdrawal is 13% less than the five-year average. If the rate of withdrawal from storage matched the five-year average of 11.0 Bcf/d from now until March 31, storage inventory would be 1,912 Bcf which is 215 Bcf higher than the five-year average of 1,697 Bcf.
Important Trends
The EIA expects production will average 94.2 Bcf/d in 2020 (up 2% from 2019) while generally declining throughout 2020, falling from an estimated 95.4 Bcf/d in January to 92.5 Bcf/d in December. The drop would mark the first annual decline in production since 2016.
In 2017, the outlook for LNG exports was promising. The United States had become a net exporter of natural gas and subsequently doubled prior-year totals in 2018 and 2019. Completed pipeline projects added to capacity and robust demand was expected to absorb some excess supply. However, the above-average winter temperatures much of the United States has experienced has been the same story for a large portion of the northern hemisphere which is composed of countries that likewise entered heating season with healthy supply levels. And so the supply glut has become a global issue, leading to low prices in nearly all foreign markets. For U.S. exporters, that could mean prices that make the cost of shipping unprofitable. Declining Asian demand in the wake of the coronavirus may compound the problem. For now, the issue hasn’t led to contract cancellations or requested re-negotiations for most exporters. With contracts scheduled months out, there’s optimism the extra supply won’t further bloat the domestic market in the immediate future. Nonetheless, this remains one to watch.
Prices
Spot prices generally rose in most locations across the report week in response to short-term forecasts for cooler temperatures. On Monday, March trading settled at $1.766/Dth – the lowest finish since March 2016. While prompt month prices recovered nearly 8 cents by Wednesday, they’ve lost almost 16% so far this year according to MarketWatch. With major natural gas producers showing signs of financial trouble, pressure from investors and economic natural selection (in the form of bankruptcies) will likely prompt declines in production. As the supply-demand balance tightens, expect prices to rebound. The 2023 and 2024 calendar strips show evidence of market confidence in this scenario.