For natural gas report week August 5, 2021, the EIA reported a net increase in storage of 13 Bcf. The injection was below forecasts which ranged from 14 Bcf to 22 Bcf and averaged 18 Bcf. In comparison, last year for the same week there was an injection of 32 Bcf and the five-year average is an injection of 30 Bcf.
Working gas in storage was 2,727 Bcf as of Friday, July 30, 2021 per EIA estimates. Inventory was 542 Bcf (-16.6%) less than last year for the same week and 185 Bcf (-6.4%) below the five-year average of 2,912 Bcf.
Natural Gas Market Recap
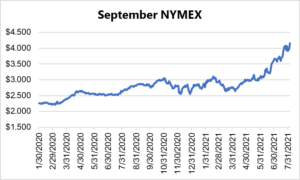
September NYMEX
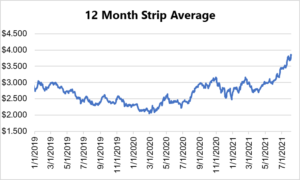
12 Month Strip
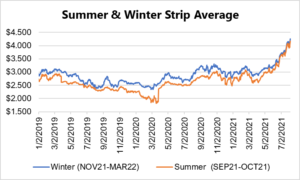
Seasonal Strips
Natural Gas Report – August 5, 2021
Fundamentals
Overall supply averaged 98.3 Bcf/d last week as production grew slightly by 0.1% and imports from Canada declined by 5.5%.
Total demand fell by 3.8% from the prior report week, averaging 89.2 Bcf/d. Residential-commercial and power generation demand decreased by 2.0% and 7.3%, respectively. Meanwhile, LNG pipeline receipts averaged 10.5 Bcf/d, falling slightly week over week.
Up to this point in injection season, the average rate of injections is 14% lower than the five-year average. If the rate of injections matched the five-year average of 8.7 Bcf/d, inventory would be 3,534 Bcf at the close of refill season. That’s 185 Bcf lower than the five-year average of 3,719 Bcf.
Natural Gas Prices
It seems that spot prices can’t settle and enjoy the mild weather of the past week. Already focused on NOAA 8–14 day forecasts for above-average temperatures, expectations for climbing demand for power generation drove spot prices higher.
Prompt month prices fell day over day, even after the EIA posted the anemic injection. Is this a sign the near-term market has hit a price that it’s unlikely to sustain with little time left in injection season?
It’s possible. Yet prompt month day-over-day losses only show part of the story. Week-over-week, prompt month prices rose from $4.059/Dth to $4.140/Dth, gaining 8.1 cents. Likewise, prices from DEC21 through APR22 continued to climb and this movement was similarly reflected in the 24- and 36-month strips. Notably, OCT21 gained 25.3 cents, settling at $4.173/Dth, suggesting the market hasn’t lost focus on end-of-season storage totals. With prices for the upcoming winter months up more than $1.00/Dth (more than 30%) since the beginning of June, it’s more likely sentiment is tied storage as well as expectations for a tight supply/demand balance, at least through the end of 2021.
DEC21, settled at $4.316/Dth, up 9.9 cents
JAN22, settled at $4.383/Dth, up 10.7 cents
FEB22, settled at $4.297/Dth, up 10.7 cents
MAR22, settled at $4.020/Dth up 10.1 cents
APR22, settled at $3.369/Dth up 7.7 cents
Strips
24 Month, settled at $3.514/Dth up 8.2 cents
36 Month, settled at $3.298/Dth up 7.9 cents
Additional Price Considerations
Throughout the summer, natural gas prices have remained sensitive to fluctuations in power-generation related demand.
Hot temperatures lead to increased cooling need which, in turn, drives power consumption higher. With roughly 35% of power generation sourced in natural gas, above-average temperatures also mean increased natural gas demand. All other factors remaining consistent, that translates to smaller injections and as seen throughout this summer, a widening of the gap between the five-year average and projected end-of-season storage totals. Generally, the wider that gap in approach of the close of injection season, the more bullish the natural gas market.
Except…price constraints. Across recent years, natural gas has enjoyed an increasing share in power generation. That’s largely because low prices made it a more affordable option than coal. However, as natural gas prices continue to rise, that’s changing. With more of its share displaced by coal, that means more natural gas going into storage. This scenario would result in downward pressure on prices.
Of course, this simplified view doesn’t account for the role renewables will play in the power generation mix. For additional analysis, check out an examination of the latest trends in the electric power sector.
Do you have the best natural gas contract for your business?
We can help you evaluate your current contract and explore your natural gas buying options. Call us at 866-646-7322 for a no-cost, no-obligation analysis today.