
Natural Gas Storage Summary
For natural gas report week, August 20, 2020, the EIA reported a net increase in storage of 43 Bcf. The build was in line with forecasts of injections ranging from 34 Bcf to 51 Bcf, averaging 43 Bcf. Last year for the same week there was an injection of 56 Bcf and the five-year average is 44 Bcf.
Working gas in storage was 3,375 Bcf as of Friday, August 14th, 2020 per EIA estimates. Inventory was 595 Bcf (21.4%) higher than last year for the same week and 442 Bcf (15.1%) more than the five-year average of 2,933 Bcf.
Natural Gas Market Recap
September NYMEX
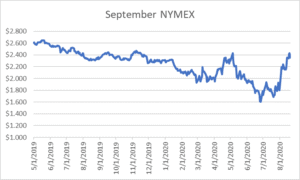
September settled Thursday at $2.352/Dth down 7.4 cents from Wednesday’s close at $2.426/Dth.
12 Month Strip
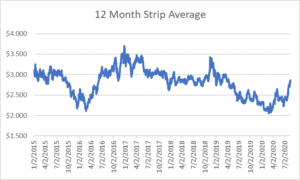
Settled Thursday at $2.849/Dth, up 11.5 cents from the prior week.
Seasonal Strips
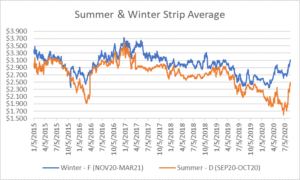
The summer strip (SEP20-OCT20) settled Thursday at $2.428/Dth, up 17.5 cents from the week prior. The winter strip (NOV20-MAR21) settled at $3.094/Dth, up 12.2 cents from last week.
Natural Gas Weekly
Natural Gas Report – August 20, 2020
Natural Gas Fundamentals
Overall supply averaged 94.5 Bcf/d last week with production declining by 0.1%. Meanwhile, imports from Canada fell by 1.2%.
The average rate of injections into storage is 11% more than that of the five-year average for this point in the refill season. If the injection rate matched the five-year average of 10.1 Bcf/d through the end of refill season (October 31st), withdrawal season would begin with 4,165 Bcf in storage, which is 442 Bcf higher than the five-year average of 3,723 Bcf.
Total demand grew by 1.5% from the prior report week, averaging 87.6 Bcf/d. Power generation and residential-commercial consumption increased by 1.8% and 1.4%, respectively. Industrial demand grew by 1.0% and exports to Mexico rose by 0.6%.
LNG pipeline receipts are up by 0.3 Bcf/d. Eleven LNG vessels with a combined carrying capacity of 40 Bcf departed the U.S. between August 13 and August 19, 2020.
The number of rigs in operation remained steady at 280 according to data from Enverus. Baker Hughes rig data shows natural gas specific rigs increased by one from last week, up to 70.
Natural Gas Prices
Henry Hub spot prices as well as prompt month, 12-month strip, and seasonal strip prices generally increased across the report week. As producer profit margins have fallen amid low prices for both oil and natural gas, spending cuts have led to historic drops in drilling. While some of the price increases may be attributed to market correction, analysts suggest it’s also partially due to expectations of a winter supply/demand imbalance.
Production is certainly below the record pace experienced last year, but it’s important to note even at the current rate, storage is still on track to conclude injection season at a surplus to last year and the five-year average. With demand recovering from the epidemic’s impact, will production at current rates sustain winter demand? Time will tell.