Natural Gas Storage Summary
For natural gas report week April 15, 2021, the EIA reported a net increase in storage of 61 Bcf. The build was in line with forecasts ranging from injections 57 Bcf to 79 Bcf, averaging 68 Bcf. Last year for the same week there was an injection of 68 Bcf and the five-year average is an injection of 26 Bcf.
Working gas in storage was 1,845 Bcf as of Friday, April 9, 2021 per EIA estimates. Inventory was 242 Bcf (-11.6%) less than last year for the same week and 11 Bcf (0.6%) more than the five-year average of 1,834 Bcf.
Natural Gas Market Recap
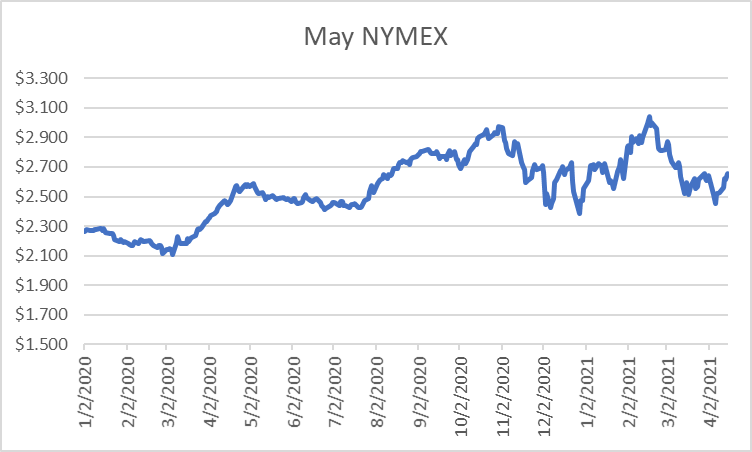
May NYMEX

Settled Thursday at $2.658/Dth, up 4.0 cents from Wednesday’s close at $2.618/Dth.
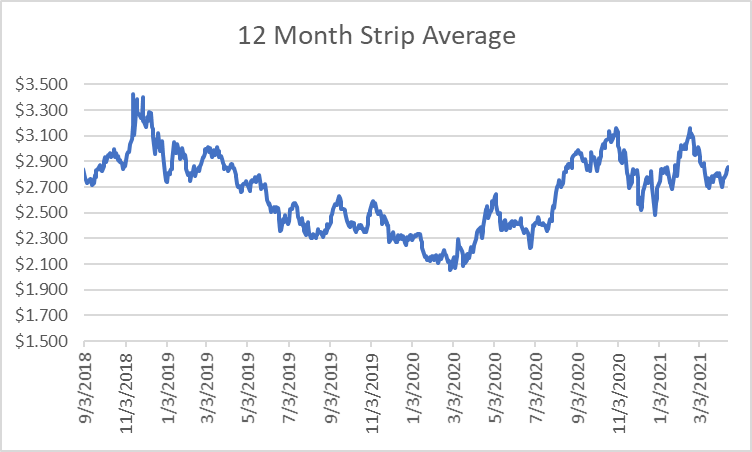
12 Month Strip

Settled Thursday at $2.856/Dth, up 8.7 cents from the prior week.
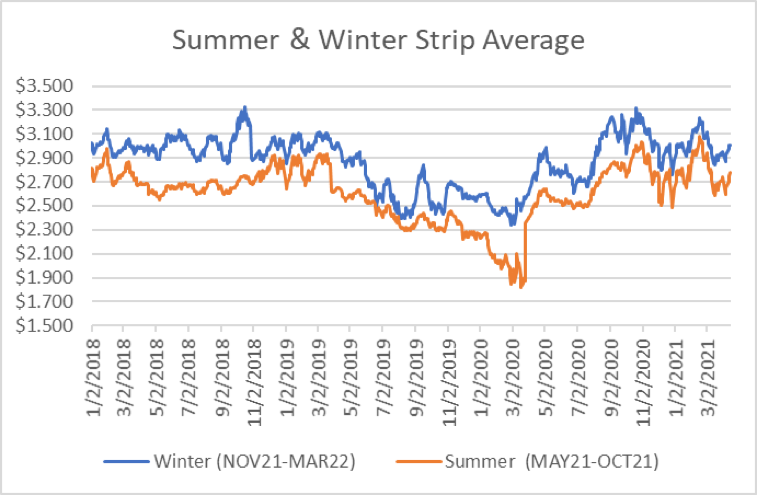
Seasonal Strips

The summer strip (MAY21-OCT21) settled Thursday at $2.779/Dth, up 11.3 cents from the week prior. The winter strip (NOV21-MAR22) settled Thursday at $3.011/Dth, up 6.8 cents from the week prior.
Natural Gas Weekly
Natural Gas Report – April 15, 2021
Natural Gas Fundamentals
Overall supply averaged 95.4 Bcf/d last week as production decreased by 1.0%. Meanwhile, imports from Canada fell by 8.5%.
Total demand dropped by 3.6% from the prior report week, averaging 88.5 Bcf/d. Residential-commercial demand declined by 16.6% on decreased consumption for heating. Consumption for power generation increased by 5.7%. Industrial demand fell by 1.7% while exports to Mexico rose by 18.4%.
LNG pipeline receipts are down by 0.5 Bcf/d from last week, averaging 11.1 Bcf/d. Twenty LNG vessels with a combined carrying capacity of 73 Bcf departed the U.S. between April 8 and April 14, 2021.
Baker Hughes rig data shows the overall number of rigs in operation increased by 2, up to 432. Natural gas specific rigs increased by two from last week, up to 93. According to the EIA, “The total rig count has increased for 4 weeks in a row, and is now 30 rigs higher than the reported March 9 total.”
Natural Gas Prices
Prices generally rose across the report week as the market seemed to draw strength from weather forecasts. Despite EIA reports of a reasonably healthy storage injection, both spot and NYMEX prices rose, likely in response to mixed temperatures throughout the country. With warmer weather settled over the west and below-average temperatures hovering over the east through the end of April, the expectation is that demand for heating and cooling will increase, giving early injection season prices some support.
Eyes on ERCOT – Again?
This week, ERCOT called on Texas energy consumers to conserve energy amid concerns supply would be insufficient to meet demand. With the impact of mid-February cold just now hitting energy bills, reports of blackouts throughout the mid-continental United States return to our attention. But this time, the weather doesn’t seem horribly extreme compared to the cold that took generation units offline and left millions without power. So why now?
Generation Shortfalls
Enverus reported that, “This is being caused by a weather pattern that is unusually warm for this time of year in South Texas. The results: strong demand and on-peak wind generation that is 6.5 gigawatts, compared with average April wind generation of 11 gigawatts. Solar generation was also lower. It hit only 38% during peak load on April 14, while the average is 72%.” But warm weather isn’t uncommon in Texas, even in April, so what’s the rest of the story? According to the Austin American-Stateman, “About 25% of Texas’ power generation potential was offline due to maintenance…” ERCOT explained that’s typical for this time of year when generation plants undergo maintenance to prepare for consistently high demand throughout summer
Price Impact
February’s blackouts and the subsequent price spikes have kept attention on ERCOT and the Texas power market. In February, wholesale electricity spot prices spiked more than 10,000% to $9,000 per megawatt hour. On Wednesday, NBC DFW5 reported prices, “…shot up, way up to $2,000 a megawatt which is about a 200% percent increase.”
The mid-February events in Texas caused a cascading impact on prices across the nation. Extreme cold in Texas froze wind turbines and brought natural gas and nuclear plants to a halt. Near cessation of production created supply shortages throughout the country. Sharp increases in spot prices followed.
Why It Matters
As we learned from February, supply restrictions and price spikes can affect energy consumers throughout the country. When it coincides with periods of high demand throughout the rest of the country, the strain on supply can amplify price volatility. The EIA reported, ” Net withdrawals from underground storage facilities in the Lower 48 states during February totaled 778 Bcf—the largest draw for any February on record since 2011—and exceeded the five-year average for February by 328 Bcf. The net withdrawals during February represented about 37% of all withdrawals from natural gas storage during the 2020-21 heating season, compared with 24% over the previous five heating seasons.” Therefore, at a time when prices were on the rise due to the intense cold in the south, consumers elsewhere were using more natural gas too. Increased consumption times skyrocketing prices meant sticker shock when bills for this timeframe arrived.
Looking forward, the current administration’s focus on renewables should account for each grid operator’s need to provide reliable, affordable power for consumers. Last week’s price increase in Texas that resulted, in part, from decreased solar and wind generation illustrates the need for diversification in generation mix. Will this keep goals for carbon free electricity by 2035 in check? Does what has occurred in Texas foreshadow things to come for prices? It’s worth watching.
