
Natural Gas Storage Summary
For natural gas report week September 3, 2020, the EIA reported a net increase in storage of 35 Bcf. The build was in line with forecasts of injections ranging from 28 Bcf to 43 Bcf, averaging 34 Bcf. Last year for the same week there was an injection of 77 Bcf and the five-year average is 66 Bcf.
Working gas in storage was 3,455 Bcf as of Friday, August 28th, 2020 per EIA estimates. Inventory was 538 Bcf (18.4%) higher than last year for the same week and 407 Bcf (13.4%) more than the five-year average of 3,048 Bcf.
Natural Gas Market Recap
October NYMEX
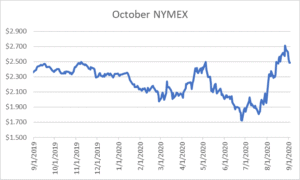
October settled Thursday at $2.487/Dth up less than a penny from Wednesday’s close at $2.486/Dth.
12 Month Strip
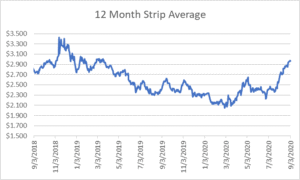
Settled Thursday at $2.969/Dth, up 4.3 cents from the prior week.
Seasonal Strips
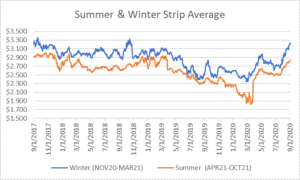
The winter strip (NOV20-MAR21) settled Thursday at $3.219/Dth, up 4.5 cents from the week prior. Looking forward to next summer (APR21-OCT21), the strip settled Thursday at $2.845/Dth, up 4.5 cents from the week prior.
Natural Gas Weekly
Natural Gas Report – September 3, 2020
Natural Gas Fundamentals
Overall supply averaged 93.1 Bcf/d last week with production remaining steady. Meanwhile, imports from Canada fell by 14.1%.
The average rate of injections into storage is 7% more than that of the five-year average for this point in the refill season. If the injection rate matched the five-year average of 10.5 Bcf/d through the end of refill season (October 31st), withdrawal season would begin with 4,130 Bcf in storage, which is 407 Bcf higher than the five-year average of 3,723 Bcf.
Total demand fell by 5.4% from the prior report week, averaging 81.9 Bcf/d. Power generation and residential-commercial consumption declined by 7.8% and 5.4%, respectively. Industrial demand fell by 0.5% and exports to Mexico dropped by 1.4%.
LNG pipeline receipts are down by 1.4 Bcf/d. Six LNG vessels with a combined carrying capacity of 21 Bcf departed the U.S. between August 27 and September 2, 2020.
The number of rigs in operation dropped two, down to 273 according to data from Enverus. Baker Hughes rig data shows natural gas specific rigs increased by three from last week, up to 72.
Natural Gas Prices
After showing some strength, natural gas prompt month prices waned. October prices dropped despite an injection that was half of last year for the same week and 31 Bcf below the five-year average. At the same time, the 12 month and seasonal strips all gained slightly more than 4 cents over the prior week. The mixed reaction may be the result of short-term demand setbacks following Hurricane Laura and 14-day forecasts for below-average temperatures for a large part of the country. Long term, expectations for demand restoration (specifically LNG exports), continued anemic production, and persisting low crude oil prices seem to be working together to give prices a boost, particularly throughout winter.
Energy and the 2020 Election
It’s hard to believe, but we have less than 60 days to go before the 2020 election. If you want to know where the candidates stand on energy policy, check out this guide from Ballotpedia.
If you have general questions about voting, here are a few more resources.
- To register to vote in Ohio, you may do so online at Ohio’s Online Voter Registration System. To vote in the November 3rd, 2020 General Election, you must register no later than October 5h, 2020.
- Want to request an absentee ballot in Ohio? The deadline is October 31, 2020. There is no online option for submitting this request.
- Online registration, polling place information, and voter registration status for individuals outside Ohio is available at gov.
- Research the candidates and issues on your ballot before you go to vote. Download your sample ballot early.