
Natural Gas Storage Summary
For natural gas report week, January 30, 2020, the EIA reported a net decrease in storage of 201 Bcf, in line with projections ranging from a withdrawal of 180 Bcf to a draw of 225 Bcf. Last year for the same week there was a withdrawal of 171 Bcf and the five-year average is a withdrawal of 143 Bcf.
Working gas in storage was 2,746 Bcf as of Friday, January 24th, 2020 per EIA estimates. Inventory was reported at 524 Bcf (23.6%) higher than last year for the same week and 193 Bcf (7.6%) more than the five-year average of 2,553 Bcf.
Natural Gas Market Recap
March NYMEX
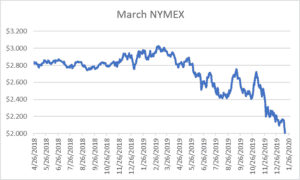
February moved off the board Wednesday, January 29th, settling the month at $1.877/Dth.
March settled Thursday at $1.829/Dth down 3.6 cents from Wednesday’s close at $1.865/Dth.
12 Month Strip
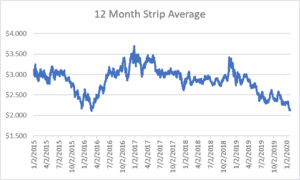
Settled Thursday at $2.148/Dth, down 1.3 cents from last Thursday.
Seasonal Strips
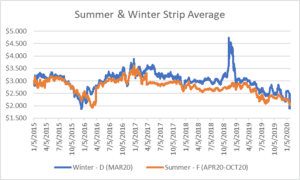
The winter strip settled Thursday at $2.431/Dth, down 6.3 cents from last Thursday. The summer strip settled Thursday at $2.031/Dth, down 6.6 cents from the prior week.
Natural Gas Weekly
Natural Gas Report – January 30, 2020
Fundamentals
Overall supply fell by 1% from last week with production remaining steady and average net imports from Canada decreasing by 9 Bcf. Total demand dropped by 10% from the prior report week with residential/commercial down 15% and power generation slipping by 6%. Industrial demand fell by 3% while exports to Mexico grew by 13%.
So far this withdrawal season, the average rate of withdrawal is 14% less than the five-year average. If the rate of withdrawal from storage matched the five-year average of 12.8 Bcf/d from now until March 31, storage inventory would be 1,890 Bcf which is 193 Bcf higher than the five-year average of 1,697 Bcf.
Weather
According to the Weather Channel, “The heart of winter has passed for most of the United States as February begins.” Both NOAA and Weather Channel February forecasts predict average to above-average temperatures for 2/3 of the United States with winter chill consolidating over the Dakotas, Minnesota, and Iowa.
Throughout January, temperatures averaged 5 degrees more than normal for this time of year with some locations in Ohio and New York reaching as much as 10 degrees above average. This contributed to a 7.1 Bcf/d decline in heating-related demand over last year at this time. It’s also had a chilling effect on prices with February’s settle and the calendar strips setting new low records.
Looking forward to the final month in winter trading, it will likely be more of the same as mild temperatures continue to depress demand, and consequently, prices. If the market is to experience a ninth-inning rally, it will need some help from production cuts. While many major natural gas producers have announced plans to reduce drilling, production rates still exceed last year at this time. It’s possible that any declines might be too little, too late.
Legislation
Last week, Ohioans Against Corporate Bailouts, the group fighting the legislation subsidizing FirstEnergy Solutions, dropped their appeal seeking more time to collect the signatures necessary to put the measure up for vote on the November ballot. As reported by Cleveland.com, Gene Pierce, a spokesman for the group stated, “’We couldn’t see a path forward. I don’t know what anybody else wants to do, but we’re done.’”
With that fight effectively over, ratepayers must now turn their attention to HB247 which may have more far-reaching consequences than HB6. Stay tuned for more details on HB247 in upcoming reports.