For natural gas report week April 29, 2021, the EIA reported a net increase in storage of 15 Bcf. The build was in line with forecasts ranging from injections of 2 Bcf to 28 Bcf, averaging 10 Bcf. Last year for the same week there was an injection of 66 Bcf and the five-year average is an injection of 67 Bcf.
Working gas in storage was 1,898 Bcf as of Friday, April 23, 2021 per EIA estimates. Inventory was 302 Bcf (-13.7%) less than last year for the same week and 40 Bcf (-2.1%) below the five-year average of 1,938 Bcf.
Natural Gas Market Recap
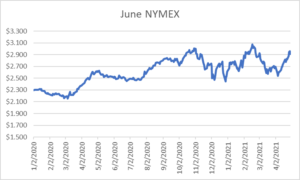
June NYMEX

May NYMEX: May moved off the board Wednesday, April 28th, settling the month at $2.925/Dth.
June NYMEX: Settled Thursday at $2.911/Dth, down 4.9 cents from Wednesday’s close at $2.960/Dth.
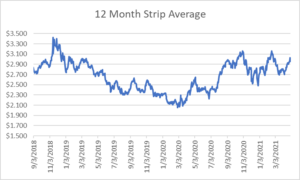
12 Month Strip

Settled Thursday at $2.955/Dth, up 1.8 cents from the prior week.
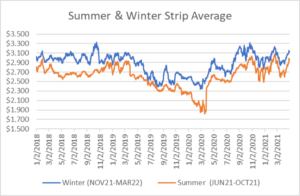
Seasonal Strips

The summer strip (JUN21-OCT21) settled Thursday at $2.955/Dth, up 8.1 cents from the week prior. The winter strip (NOV21-MAR22) settled Thursday at $3.119/Dth, up 2.8 cents from the week prior.
Natural Gas Weekly
Natural Gas Report – April 29, 2021
Natural Gas Fundamentals
Overall supply averaged 96.1 Bcf/d last week as production grew by 0.9%. Meanwhile, imports from Canada fell by 9.5%.
Total demand dropped by 5.9% from the prior report week, averaging 90.4 Bcf/d. Residential-commercial demand declined by 17.7% on decreased consumption for heating. Consumption for power generation increased by 1.5% Industrial demand fell by 3.0% while exports to Mexico declined by 4.7% (yet remains 28% above last year’s levels).
LNG pipeline receipts are down by 0.3 Bcf/d from last week, averaging 11.3 Bcf/d. Twenty LNG vessels with a combined carrying capacity of 73 Bcf departed the U.S. between April 22 and April 28, 2021.
Baker Hughes rig data shows the overall number of rigs in operation decreased by 1, down to 438. Natural gas specific rigs remained steady at 94.
Natural Gas Prices
The May contract expired on Wednesday after gaining more than 30 cents since the beginning of the month. Both June and 12 Month Strip prices posted losses while the remainder of the summer strip gained over 8 cents. With sluggish production and increasing demand, there’s already growing concern over end-of-injection season storage totals which has also boosted near-term winter strip prices. At the time of publication, prices were as follows: NOV, $3.055/Dth; DEC, $3.180/Dth; JAN, $3.258/Dth.
EIA’s April Natural Gas Monthy
The EIA’s publication highlighted the energy price spike of February 2021.
“In February 2021, some natural gas prices, especially citygate, electric power, and export prices, reached record highs in several states due to extreme weather for the month.
• The electric power price for the United States was the highest for any month since we began tracking electric power prices in 2002, at $16.29 per Mwh. This price was 31.3% greater than the previous highest price of $12.41 per Mwh in June 2008. Kansas, Nebraska, New Mexico, Texas, and Wyoming all featured record high prices, in some cases several times higher than the previous highs.
• The price of U.S. natural gas exports was the highest for any month since we began tracking export prices in 1989, at $12.65 per Mcf for the month. This price was 6.3% greater than the previous highest price of $11.90 per Mcf in July 2008. This record high price was in large part driven by the price of natural gas pipeline exports to Mexico, which was $27.03 per Mcf for the month, or 132% greater than the previous highest price of $11.65 per Mcf in June 2008.”
Do you have the best natural gas contract for your business?
We can help you evaluate your current contract and explore your natural gas buying options. Call us at 866-646-7322 for a no-cost, no-obligation analysis today.
